Figures & data
Figure 1. Temperatures (°C) of the hands and feet plotted against dive time (min) for the DD (dry-dry), DW (dry-wet), and WW (wet-wet) configurations.
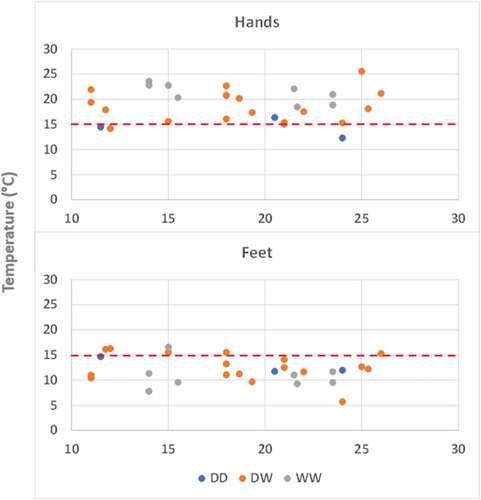
Figure 2. Mean ± SE temperatures (°C) of the hands and feet at the start and end of dives for the DD (dry-dry), DW (dry-wet), and WW (wet-wet) conditions. * indicates significant differences in the starting hand temperatures between the DD, DW, and WW conditions and ** indicates significant differences in the end-point hand temperatures between the respective conditions. The elbowed lines indicate significant temperature differences between the start and end times (e.g. Hands in vs Hands out for both DW and WW conditions).
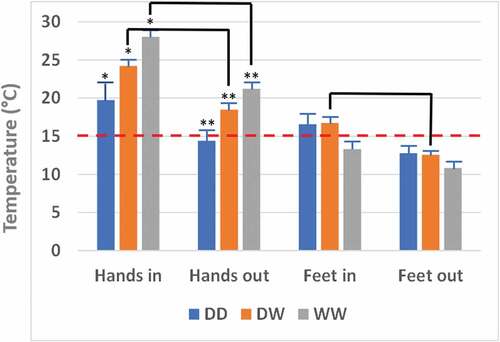
Figure 3. Mean ± SE rates of change (Δ) of temperatures (°C/min) of the hands and feet for the DD (dry-dry), DW (dry-wet), and WW (wet-wet) conditions. * and ** indicate significant differences between the hands and feet for the DW and WW conditions, respectively.
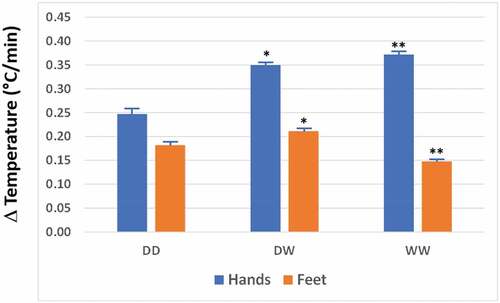
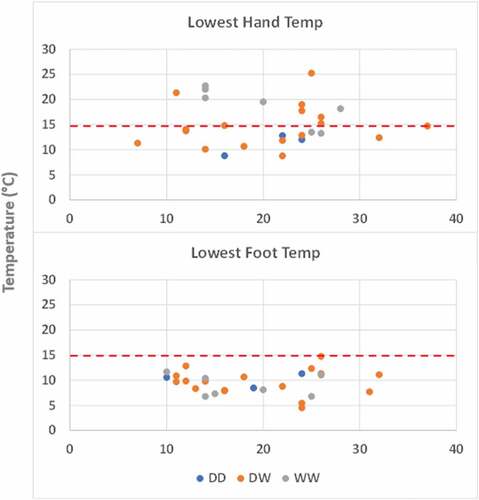
Figure 4. Lowest recorded temperatures (°C) of the hands and feet plotted against dive time (min) for all 28 subjects across 64 dives under the DD (dry-dry), DW (dry-wet), and WW (wet-wet) conditions.