Figures & data
Table 1. Baseline characteristics of participants.
Table 2. TBC1D4 genotype distribution among individuals with and without albuminuria and CKD.
Table 3. Cross-sectional analysis of the effect of diabetes on albuminuria: stepwise logistic regression presented as odds ratios (ORs).
Table 4. Cross sectional analysis of the effect of diabetes on CKD: stepwise logistic regression presented as odds ratios (ORs).
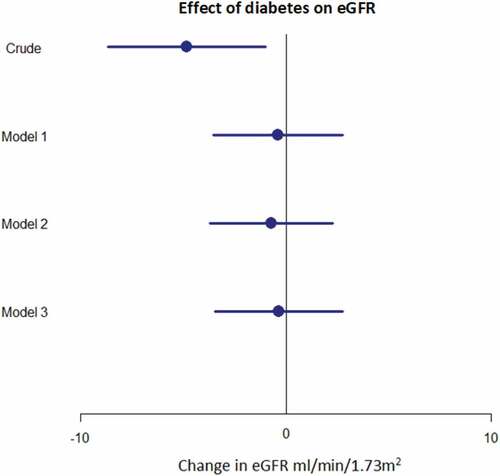
Figure 1. The effect of diabetes on eGFR at follow-up adjusted for baseline eGFR using linear regression, expressed as a proportion change in follow-up eGFR. Model 1: adjusted for age and sex. Model 2: model 1 + BMI, systolic and diastolic blood pressure, LDL cholesterol, TG, smoking and years between baseline and follow-up. Model 3: model 2 + the TBC1D4 variant and admixture (from Table S2).
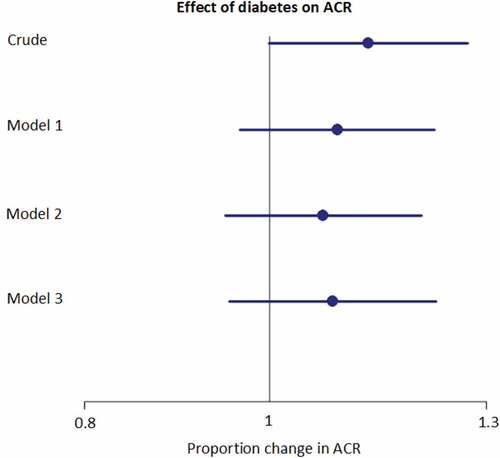
Figure 2. The effect of diabetes on ACR at follow-up adjusted for baseline ACR using linear regression, expressed as a proportion change in follow-up ACR. Model 1: adjusted for age and sex. Model 2: model 1 + BMI, systolic and diastolic blood pressure, LDL cholesterol, TG, smoking and years between baseline and follow-up. Model 3: model 2 + the TBC1D4 variant and admixture (from Table S1).