Figures & data
Table 1. Participants instrumented during each transit.
Table 2. List of materials and fabrics observed or reported for each clothing layer worn by participants undertaking small boat transits (n=6).
Table 3. Environmental conditions during boat transits from the local weather station.
Figure 1. Individual core body temperature. Note: P=participant, T=transit.
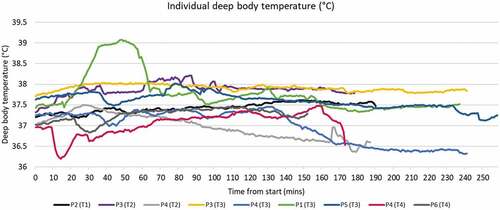
Figure 2. Example of skin temperature during transit 1. Note: Proximal includes, chest, back, neck, thigh, upper arm and lower arm.
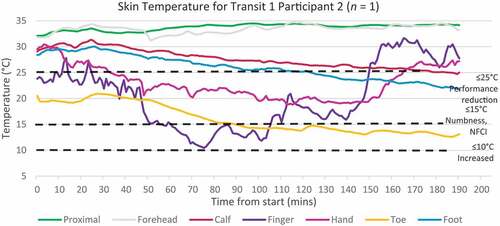
Table 4. Total number of minutes spent within each temperature band across all participants and all four exercises.
Figure 3. Average heart rate across each sea transit. Transit 1 (T1) n=1, Ttransit 2 (T2) n=2, transit 3 (T3) n=4, transit 4 (T4) n=2. Data were averaged between transits to demonstrate the overall trend.
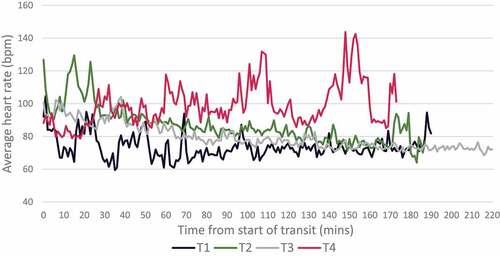
Figure 4. Individual thermal sensation and comfort scores for whole body, hands and feet following the cold weather sea transits. Data comprised from transit 1–3 cold weather transits across five participants with repeat scores for P3. Subjective scale data were not collected from transit four or P4 during transit three due to access to participants.
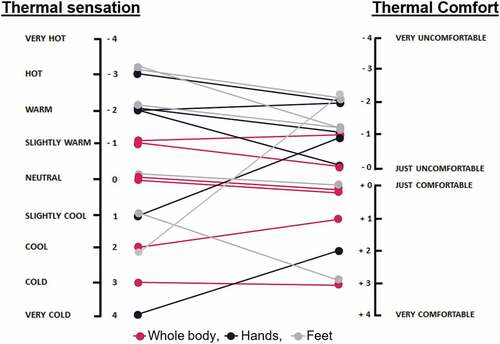
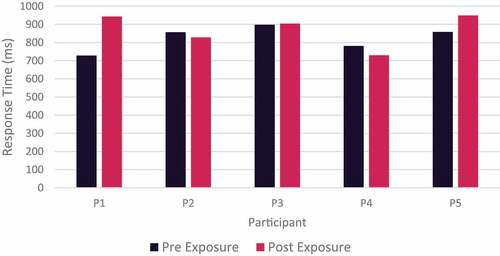
Figure 5. Individual reaction time during speed task pre- and post- sea transit.
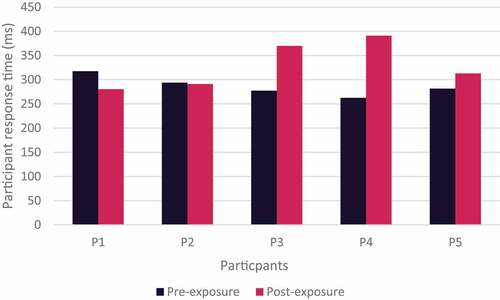
Figure 6. Individual participants response time during Stroop task by participant pre- and post- cold weather exposure.