
Figures & data
Table 1. Conditions for occupational pathology.
Table 2. Structure of occupational pathology.
Figure 1. Annual number of newly diagnosed occupational diseases and workers with occupational pathology in 2007–2021.
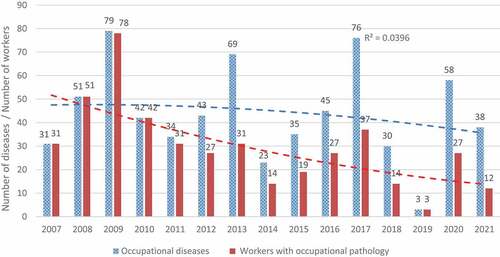
Figure 2. Growing number of occupational disease diagnoses per employee from 2007 till 2021.
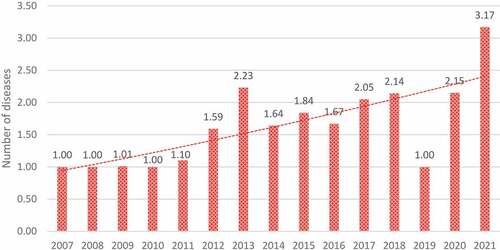
Table 3. Age, length of service and number of occupational diseases per employee.
Table 4. Occupational hazards and circumstances for occupational pathology.
Table 5. Occupational diseases categories.
Data availability statement
All data relevant to this manuscript are in the body of the manuscript.