
Figures & data
Figure 1. Flow chart of the phases of the literature search and selectionFootnote3
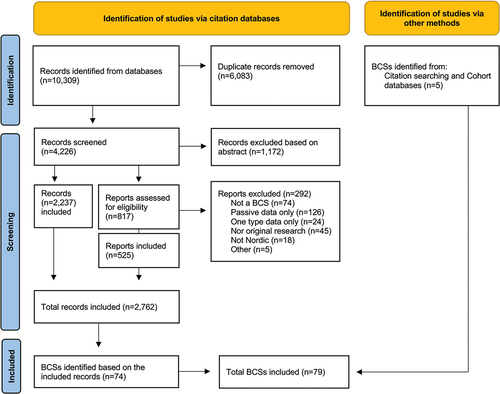
Table 1. Characteristics of 79 Nordic birth cohort studies divided by age of enrolment.
Figure 2. Timeline of the Nordic birth cohorts.Footnote5
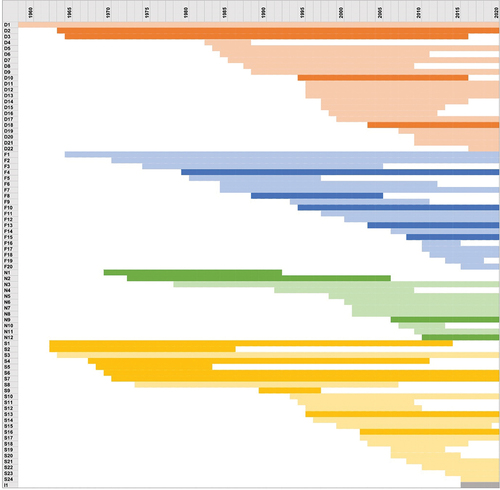
Figure 3. The number of birth cohort studies by country (in green rectangles) and approximate total number of index children recruited in them.
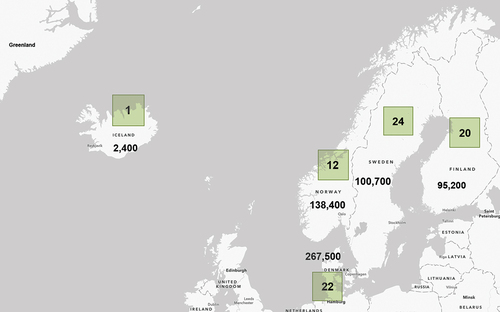
Figure 4. Map of the Arctic administrative areas and the Nordic birth cohorts located in the Arctic area (marked as black).Footnote6
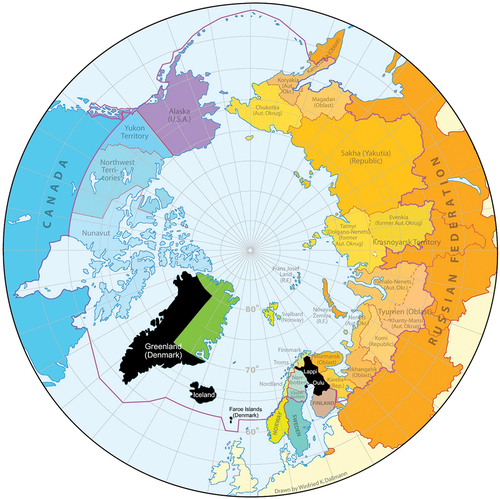
Table A1. Databases included in EBSCO and ProQuest.