
Figures & data
Table 1. Descriptive statistics for all 72 school-children – mean and SD (for normally distributed data), and median with range (for not normally distributed data) as well as minimum and maximum values.
Table 2. Valid days with accelerometer data (numbers and column %).
Figure 1. Percentage of school-children (n = 48) with at least 60 min PA per day through the week.
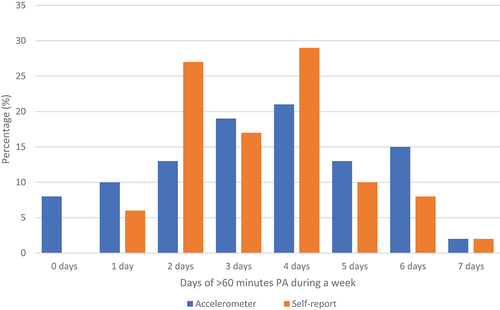
Table 3. Number of school-children adhering to WHO recommendations of >60 min PA per day on average.