
Figures & data
Figure 1. Show the CT derived body composition at third lumbar level. (a) A 24 year-old man of inuit decent with BMI 23.9; (b) A 19 year-old man of European decent with BMI 23.6; (c) A 29 year-old women of inuit decent with BMI 23.4; (d) A 40 year-old women of European decent with BMI 22.5. BMI: body mass index.
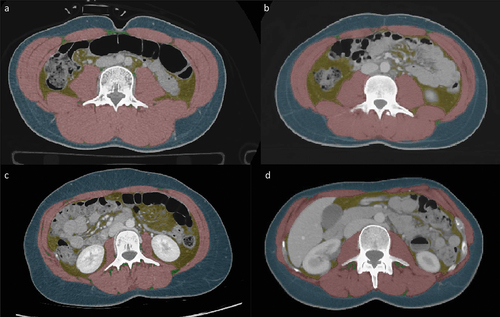
Figure 2. The selected variables are based on the following the simplified directed acyclic graph (DAG).
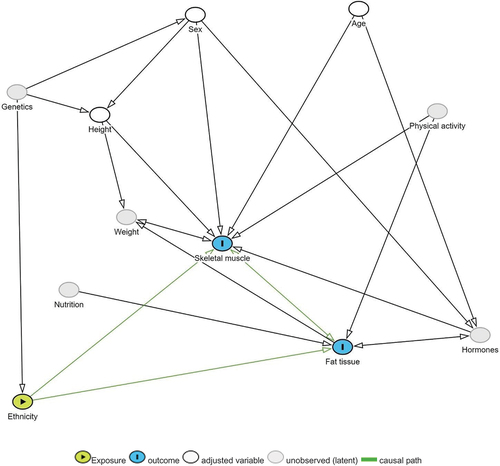
Figure 3. Shows the flow diagram of exclusion and inclusion of individuals from Nuuk, Greenland. CT: computed tomography.
Table 1. Shows the demographic characteristic for the total study population and stratified by Inuit and European study population.
Table 2. Shows the body composition measures (median, (min, max)) between Inuit and European study population.
Figure 4. Shows the boxplots of the of body composition measures divided by sex and ethnicity. *p – value < 0.05 between ethnicity stratified by sex **p – value < 0.05 between sexes.
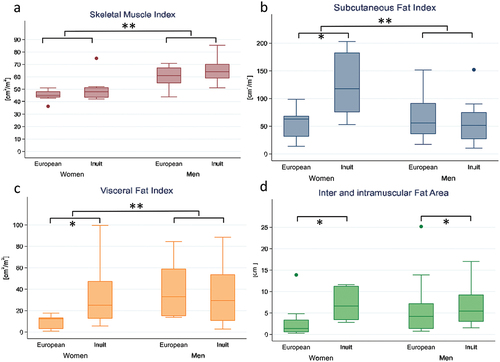
Table 3. Shows the univariate linear regression models for each of the body composition measures and each of the demographic variables ethnicity, age, height, and sex. Results are presented as estimates and 95% confidence intervals.
Table 4. Shows the multiple linear regression predictions for each of the body composition measures based on the variables ethnicity, age, height, and sex.
Supplementary material clean revised.docx
Download MS Word (1.7 MB)Data availability statement
Data is not available due to ethical and legal data policies.