Figures & data
Table 1. Published spectral indices for plant water and dry matter.
Figure 1. Variations in reflectance and first-derivative reflectance for green leaves of different plant species attributed to progressive dehydration within 36 hours.
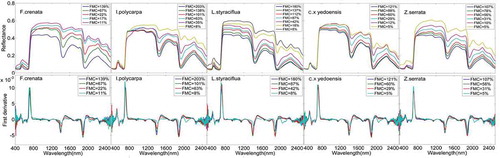
Figure 2. Variations in reflectance and first-derivative reflectance for litter leaves of different plant species attributed to progressive dehydration within 36 hours.
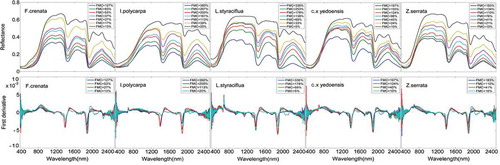
Table 2. Published spectral indices for the estimation of FMC, EWT, and LMA based on different datasets.
Table 3. Evaluation of four types of indices with original reflectance for FMC, EWT, and LMA.
Table 4. Evaluation of four types of indices with first derivative of reflectance for FMC, EWT, and LMA.
Figure 3. R2 and RMSE of FMC estimation with dND type indices (pooled dataset). The positions with black circles in the figures are the selected dND (1900, 2095).
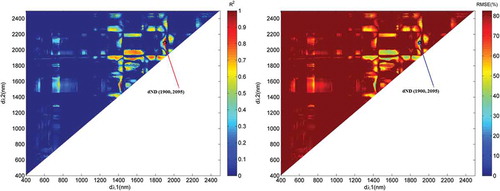
Figure 4. Variations in first derivative spectra at 1900nm (d1900) and 2095 nm (d2095) with dehydration time.
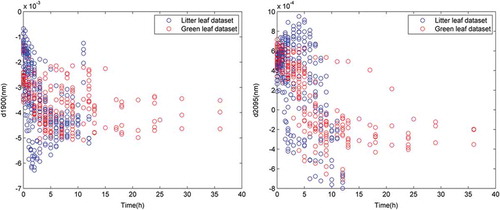
Figure 5. Regressions of SR (1300, 1450) and EWT, ND (2305, 1495) and LMA, and SR (1300, 1450)/ND (2305, 1495) and FMC.
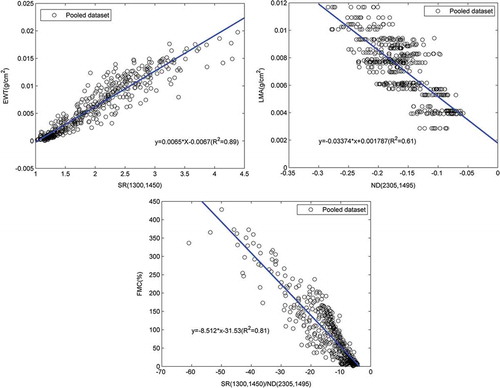
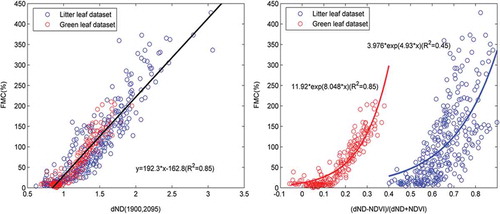
Figure 6. Regressions of dND (1900, 2095) and FMC, and (dND-NDVI)/(dND+NDVI) and FMC.