
Figures & data
Table 1. NDVI applications used in this study with spatial and temporal resolution and period of data availability.
Figure 1. Study area includes all of Indonesia and parts of other South East Asian countries.
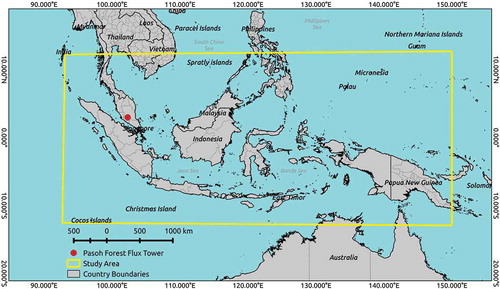
Table 2. Type 3 classification scheme of MOD12Q1 and the associated notation for each classes in this study.
Table 3. Trend map categories derived using the Mann–Kendall test.
Table 4. Matrix to calculate the percentage of similarity.
Figure 2. Distribution of average NDVI values from time series Landsat 5 TM and 8 OLI used for validating NDVI from coarse resolution data.
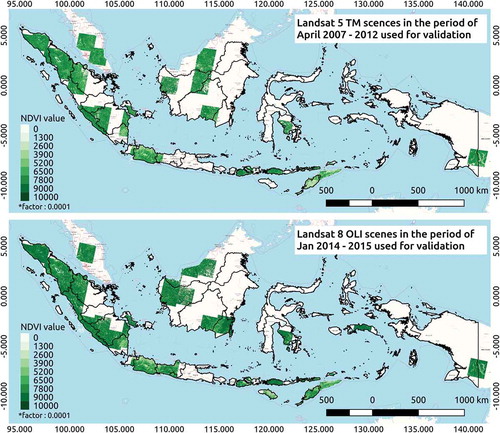
Figure 3. Scatter plot of monthly average and maximum NDVI values at Pasoh Rainforest, Malaysia.
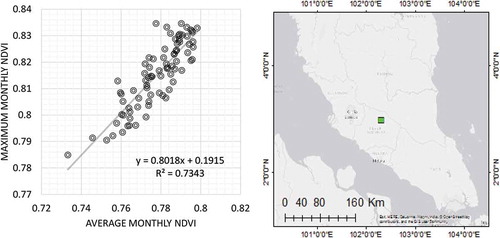
Table 5. NDVI data used in the regression analysis.
Table 6. Correlation coefficients for pairwise comparison of different NDVI datasets at spatial resolutions of 1, 4 and 8 km during April 2007 to March 2012 (60 months) and January 2014 to December 2015 (24 months).
Figure 4. Average correlation of coefficient map of NDVI products estimated from the pairwise comparison between existing NDVI products.
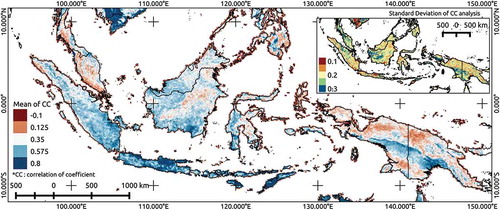
Figure 5. Boxplot showing the statistical properties of correlation coefficient for different land cover types at different spatial resolutions of 1, 4 and 8 km.
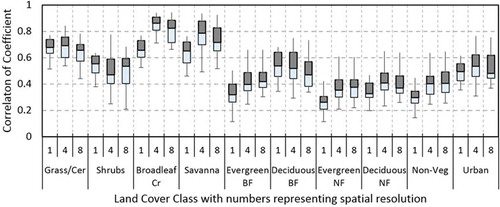
Table 7. Percentage of spatial similarities in trend maps in vegetation areas estimated from different NDVI time series applications at spatial resolution of 1, 4 and 8 km.
Figure 6. Greening and browning trends over 60 months mapped using different NDVI time series applications at different spatial resolutions.
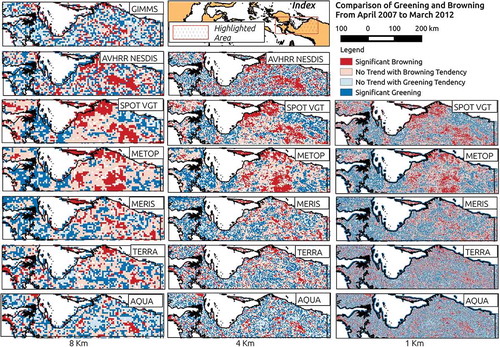
Table 8. Matrix of average distribution of spatial similarities in vegetation areas from trend maps derived using different NDVI applications.
Table 9. Similarity percentages of breakpoints detected from coarse resolution NDVI products during a) 2007–2012, and b) 2014–2015.
Figure 7. NDVI values for the vegetation cover taken from a.) SPOT-VGT (during 2007 – 2012) and b.) MODIS Terra (during 2014 – 2015) displayed a strong fit with NDVI from Landsat 5 TM and Landsat 8 OLI.
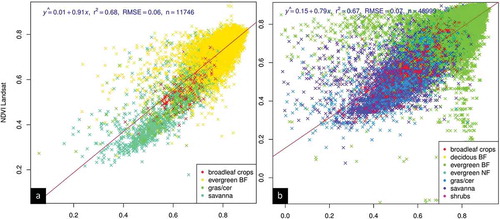
Table 10. Regression results from NDVI coarse resolution products versus Landsat systems.
Table 11. Linear regression and corresponding R-squared and RMSE derived from comparison between NDVI values from satellite data and flux tower datasets.