
Figures & data
Figure 1. Flowchart of the designed framework
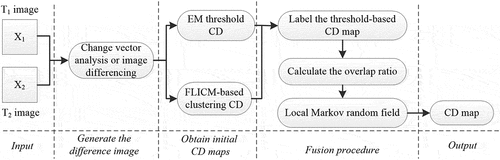
Figure 2. Flowchart of the spatial advantage fusion strategy
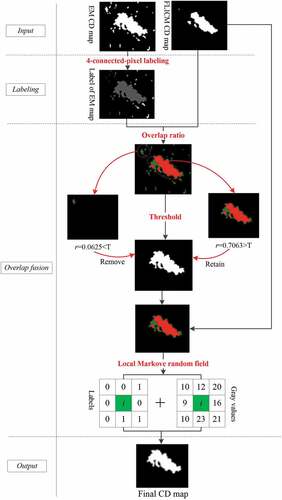
Figure 3. Band 4 of the data set 1 acquired in (a) April 2000 and (b) May 2002, and (c) is the ground reference map
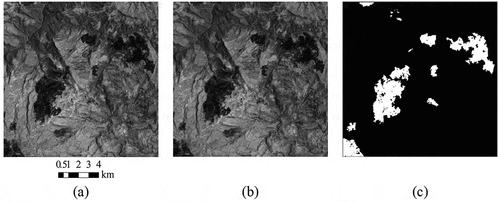
Figure 4. Change patterns of the CD accuracy indices with (a) the ranging threshold T and (b) the changing weight parameter β for the data set 1
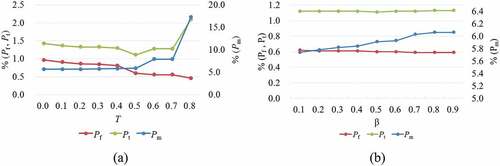
Figure 5. CD results of the data set Mexico obtained by (a) EM, (b) EMMRF, (c) FLICM, (d) SACM, (e) UDWTAC, (f) proposed method, and (g) is the ground reference map
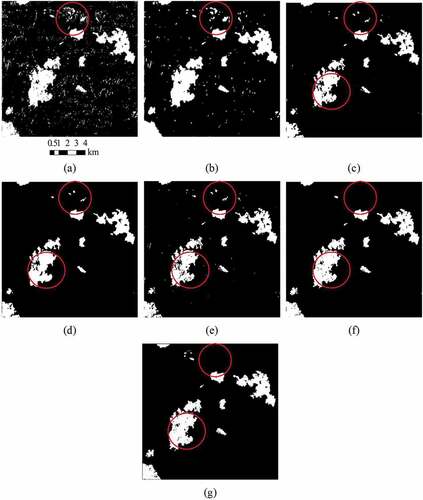
Table 1. Quantitative CD results of the data set 1. Pm, Pf and Pt are ratios of missed detections, false alarms and total errors, respectively, and represents the kappa coefficient
Figure 6. False color composite (R-4, G-3 and B-2) of the data set 2 acquired in (a) August 2001, (b) August 2002, and (c) is the ground reference map
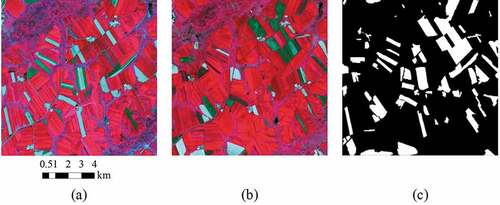
Figure 7. Change patterns of the CD accuracy indices with (a) the increasing threshold T and (b) the changing weight parameter β for the data set 2
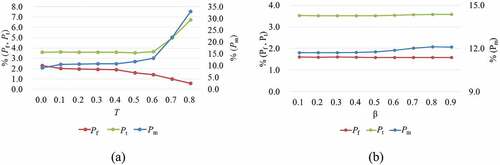
Figure 8. CD results of data set farmland obtained by (a) EM, (b) EMMRF, (c) FLICM, (d) SACM, (e) UDWTAC, (f) proposed method, and (g) is the ground reference map
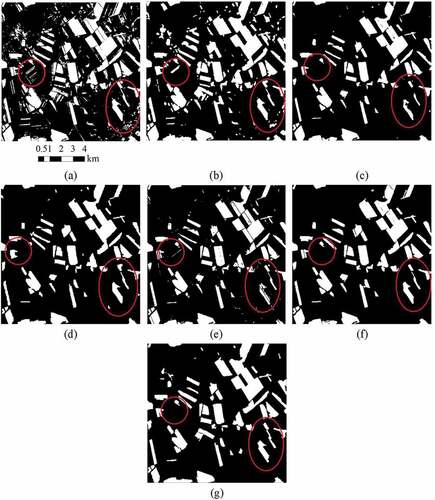
Table 2. Quantitative CD results for the data set 2. Pm, Pf, and Pt are ratios of missed detections, false alarms and total errors, respectively, and represents the kappa coefficient