Figures & data
Figure 1. SUSM model structure.
Figure 2. Urban growth curve (S growth curve).
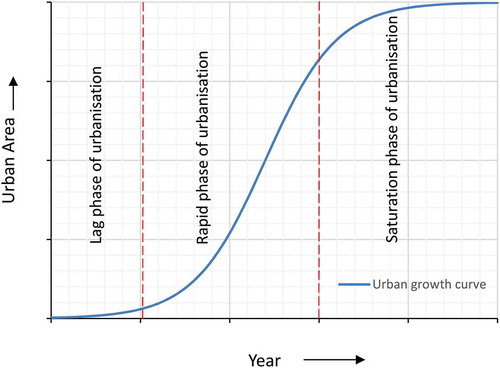
Table 1. Confusion matrix for validation of SUSM’s simulation.
Figure 3. Pune metropolis, PMC: Pune Municipal corporation, PCMC: Pimpiri Chinchwad Municipal Corporation, PCB: Pune Cantonment Board, KCB: Kirkee Cantonment Board.
Figure 4. Input datasets of SUSM.
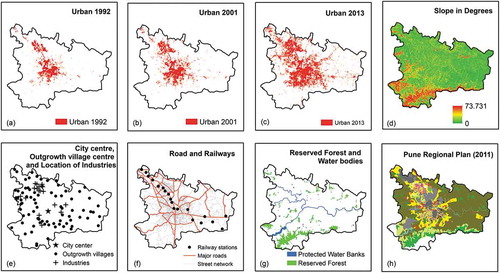
Table 2. Location of urban growth seeds supplied to SUSM in scenario 1.
Table 3. Logistic regression coefficients for the period of 1992 to 2001.
Table 4. Comparison of projected urban area to the remote sensing–derived urban area.
Figure 5. The urban growth curve of Pune metropolis (total area:1643 km2).
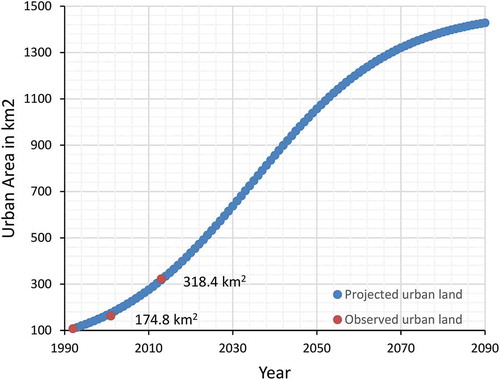
Figure 6. SUSM simulations used for validation (a) Urban growth transition potential and (b) Urban growth simulation maps of 2013.
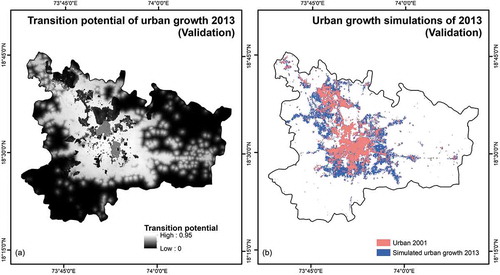
Table 5. Validation results of SUSM.
Figure 7. (a) Validation map showing the pixel level comparison of SUSM’s urban growth simulation with respect to observed urban growth from 2001 to 2013. (b) ROC curves of modelled urban growth transition potential of Pune for 2013.
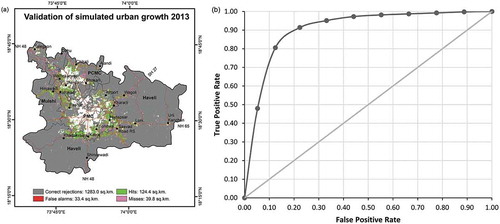
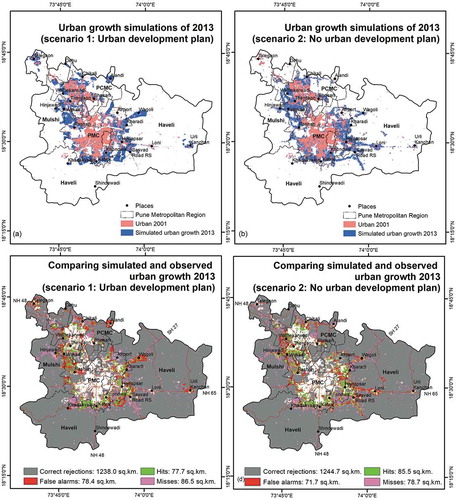
Figure 8. (a) Urban growth simulations based on scenario 1: urban development plan (i.e. PMR regional development plan), (b) Urban growth simulations based on scenario 2: no urban development plan (i.e. business as usual based on the historic trend observed from 1992–2001 and without any future development measures), (c) and (d) comparison of simulated growth of Pune based on scenario 1 and scenario 2, respectively, with observed urban growth from 2001 to 2013.