Figures & data
Figure 1. Map of the Biosphere Reserve area located in southwest Spain with underlying Sentinel-2 RGB image on 21/02/2018. Blue line: boundary of the Reserve area, Red shaded area: marshland wetland area.
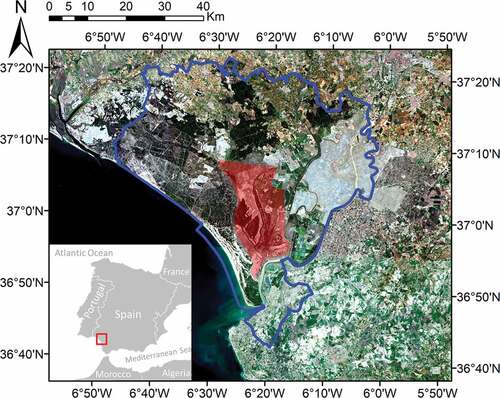
Figure 2. (a) S2 inundation map on 02/04/2017 (with pale red over blue is denoted the marshland area), (b) VV and (c) VH polarization bands of S1 image on 02/04/2017.
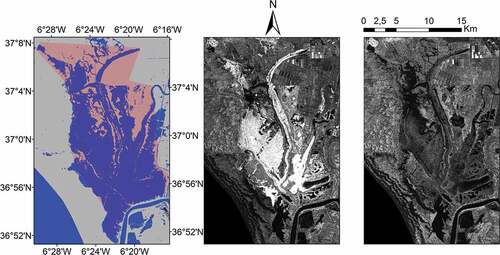
Figure 3. Schematic flow diagram of the pixel centric classification approach.

Figure 4. Schematic flow diagram of the area centric classification approach.
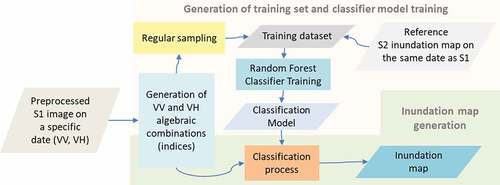
Figure 5. Schematic flow diagram of the simple thresholding approach.
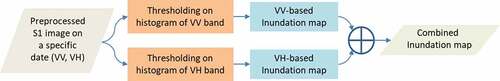
Table 1. Features used for classification training.
Table 2. Dates of coinciding S1 and S2 acquisition. Green colour highlights the presence of emergent vegetation covering the marshland area.
Figure 6. Kappa of four different pairs in relation with the Mean Day Difference of the S2 reference map to the S1 target date (TIM case).
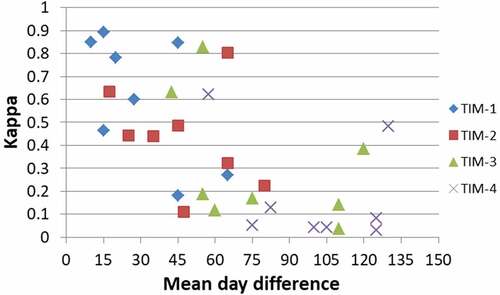
Figure 7. Kappa of four different groups in relation with the Mean Day Difference of the S2 reference map to the S1 target date (GRP case).
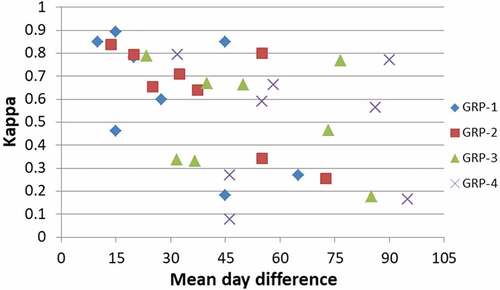
Figure 8. Inundation map on 04/10/2016 for GRP case, GRP-2, (a) before noise removal, (b) after noise removal. Water and dry areas are denoted with blue and gray, respectively, and with pale red is denoted the marshland area.
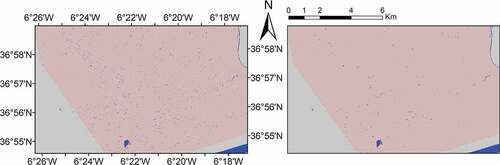
Figure 9. Kappa of four different pairs (TIM case) in relation with the Mean Day Difference of the S2 reference map to the S1 target date, after taking into consideration possible misclassified outcomes.
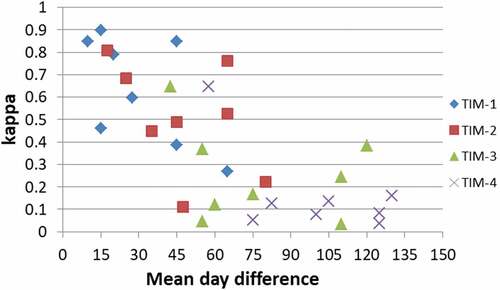
Figure 10. Kappa of four different groups (GRP case) in relation with the Mean Day Difference of the S2 reference map to the S1 target date, after taking into consideration possible misclassified outcomes.
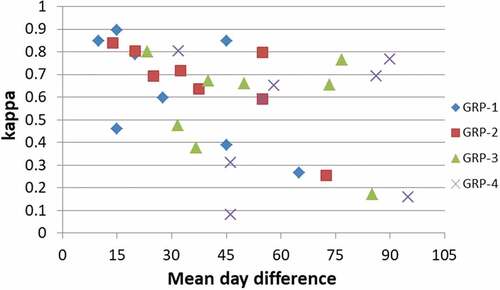
Figure 11. Kappa of TIM case per date and pair after classification speckle effect minimization, given in clustered columns; kappa of the area centric reference classification given as orange line with markers (referred to as ‘Ref.1’); and kappa of the simple thresholding given as yellow line with markers (referred to as ‘Ref.2’). The mdd value of each date and pair is given on top of the corresponding column indicating kappa.
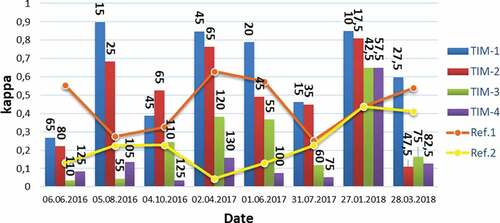
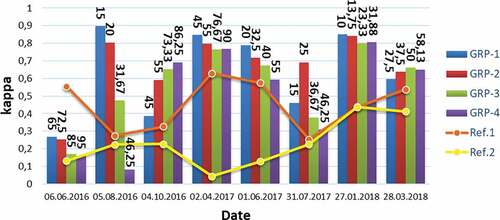
Figure 12. Kappa of GRP case per date and group after classification speckle effect minimization, given in clustered columns; kappa of the area centric reference classification given as line with markers (referred to as ‘Ref.1’); and kappa of the simple thresholding given as yellow line with markers (referred to as ‘Ref.2’). The mdd value of each date and group is given on top of the corresponding column indicating kappa.