
Figures & data
Table 1. The compositions of laboratory mineral powders (2-endmember mixtures)
Figure 1. The spectra of laboratory mineral powders (2-endmember mixtures)
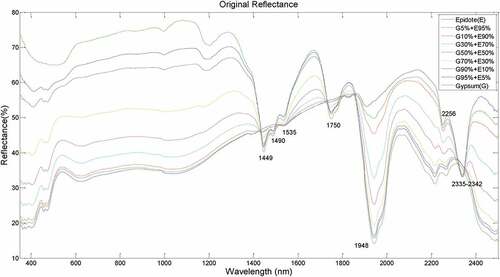
Table 2. The compositions of laboratory mineral powders (3-endmember mixtures)
Figure 2. The spectra of laboratory mineral powders (3-endmember mixtures). (left: endmembers; right: mixtures)
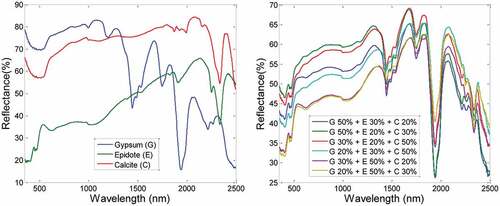
Figure 3. The endmember spectra of AVIRIS Cuprite data
Table 3. Selected pixels for endmembers of ATREM and Flat Field datasets
Figure 4. The endmember spectra of ATREM and Flat Field datasets (left: ATREM; right: Flat Field)
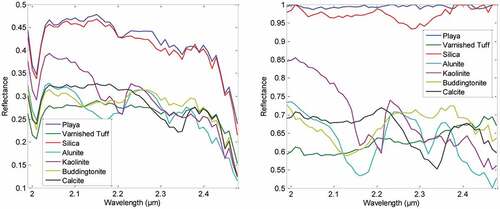
Figure 5. The flowchart of the data processing used in mixing reflectance reconstruction
Figure 6. The flow chart of the analysis of laboratory data
Figure 7. Flow chart of the analysis of airborne data
Table 4. Abundance estimation results (volume proportion of gypsum) of the models (2-endmember (Gypsum (G) and Epidote (E)) powder mixtures)
Figure 8. Reconstructed spectra and real spectra of 2-endmember powder mixtures
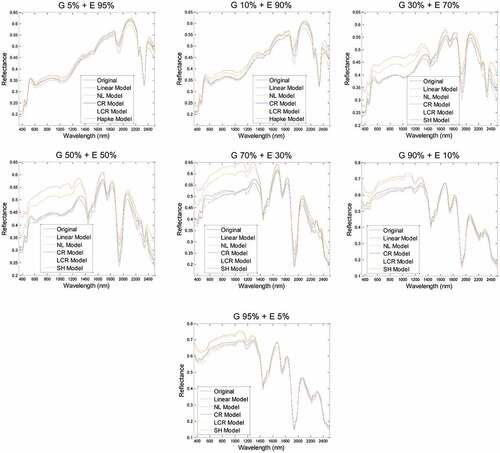
Figure 9. MRR error (RRMSE) of the models in the spectral dimension (2-endmember powder mixtures)
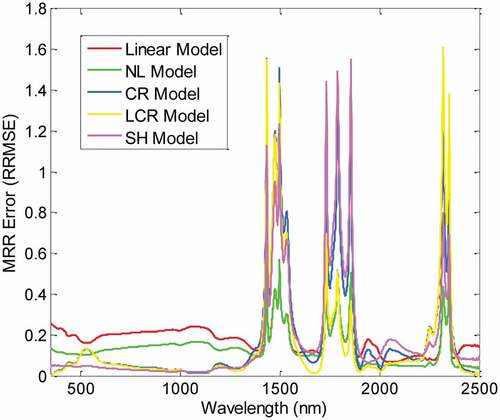
Figure 10. Boxplot of the MRR error (RRMSE) of the models in the spectral dimension (2-endmember powder mixture)
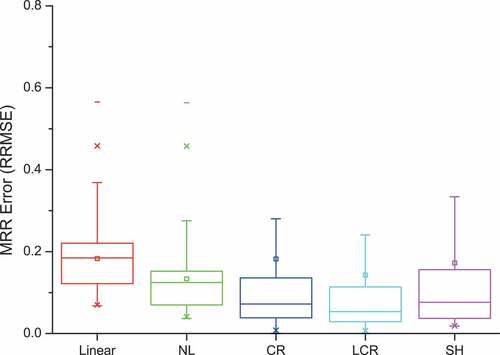
Table 5. MRR error (RRMSE) of the models in the spatial dimension (2-endmember (Gypsum (G) and Epidote (E)) powder mixtures)
Figure 11. Boxplot of MRR Error (RRMSE) in the spatial dimension (2-endmember powder mixtures)
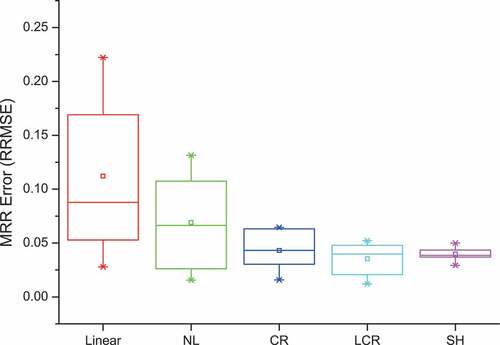
Table 6. MRR error (RRMSE) of the models in the combined dimension (2-endmember powder mixtures)
Table 7. MRR error (RRMSE) of the models in the combined dimension (3-endmember powder mixtures)
Figure 12. Abundance maps of selected materials for the AVIRIS data. (top to bottom: buddingtonite, alunite #1, kaolinite, alunite#2, and calcite; left to right: linear model, NL model, CR model, LCR model, and SH model)
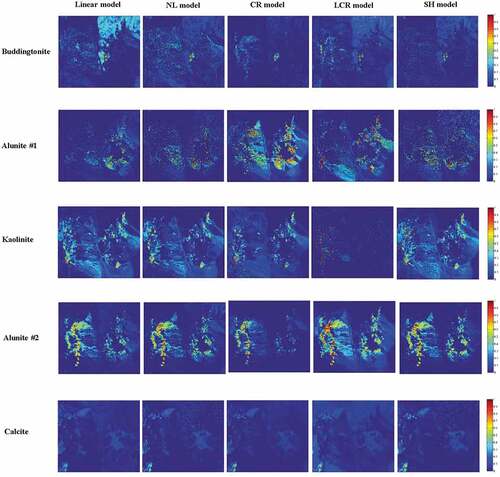
Figure 13. 3D data cubes of original reflectance data and MRR results. (line 1 from left to right: original data, linear model, NL model; line 2 from left to right: CR model, LCR model, and SH model)
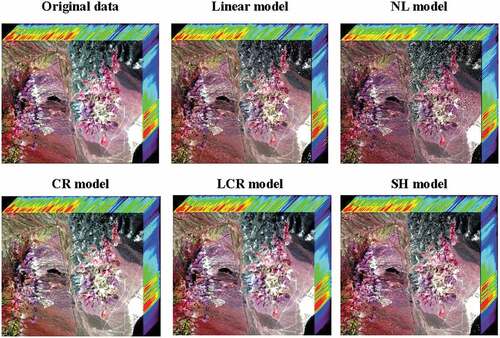
Figure 14. MRR error (RRMSE) of AVIRIS data in the spectral dimension
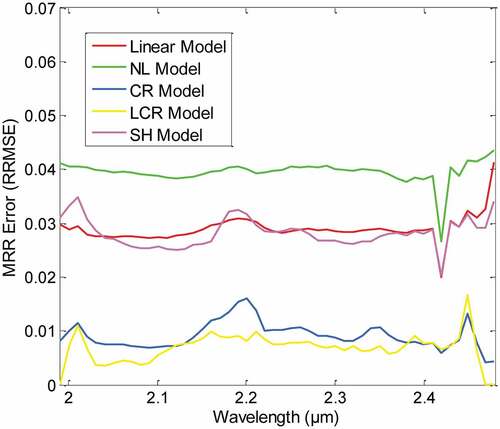
Figure 15. Boxplot of the MRR error (RRMSE) of AVIRIS data in the spectral dimension
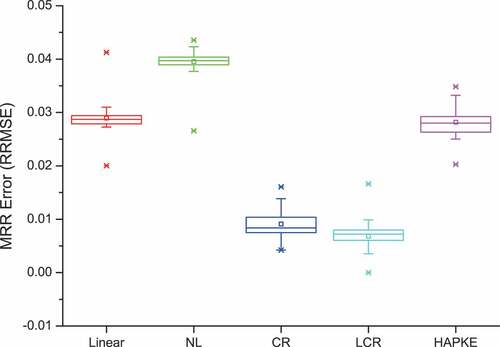
Figure 16. Maps of MRR error (RRMSE) in the spatial dimension for AVIRIS Data
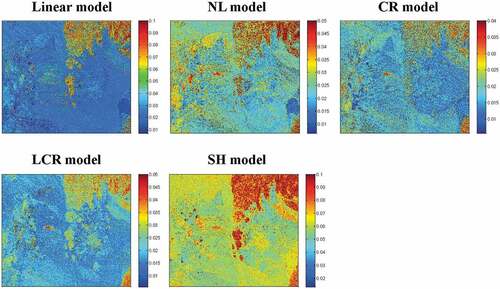
Figure 17. Abundance maps consistent with maps of MRR error (RRMSE)
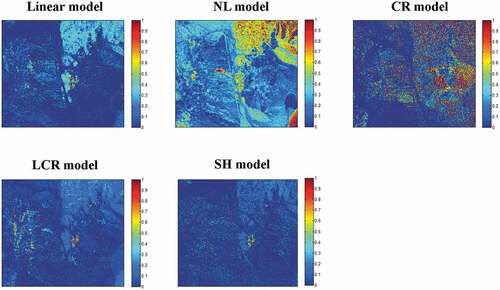
Figure 18. Boxplot of the MRR error (RRMSE) of AVIRIS data in the spatial dimension
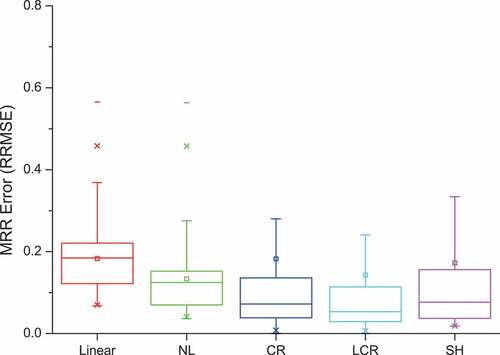
Table 8. MRR error for AVIRIS data in the combined dimension
Table 9. MRR error (RRMSE) for ATREM and Flat Field datasets in the combined dimension