
Figures & data
Figure 1. Epicentre topography and historical earthquake map of the L’Aquila earthquake, blue box represents study area
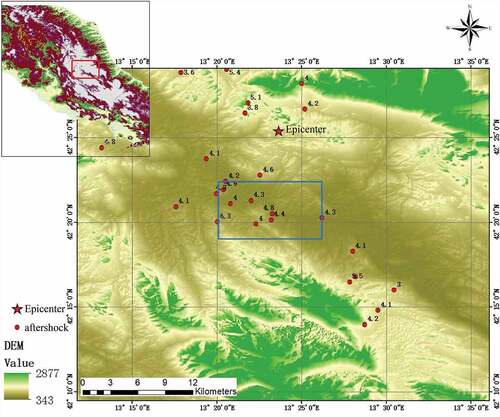
Table 1. The main characteristics of the SAR datasets
Figure 2. Multi-temporal SAR datasets of the L’Aquila earthquake zones:(a) and (b) represent ENVISAT-ASAR images before and after the L’Aquila earthquake, respectively. A and A’ represent the same area of the image before and after the earthquake, respectively. The small graph on the right side shows the enlarged image. The obvious difference can be seen in the red circle of the small map
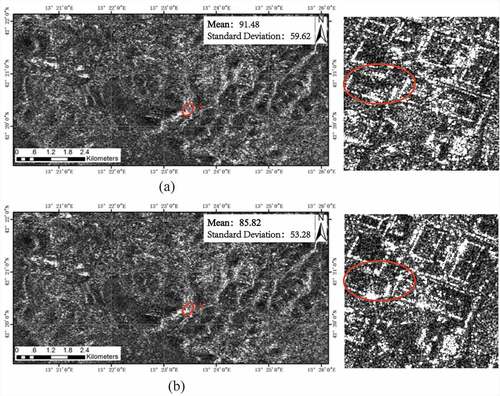
Figure 3. Damage distribution of L’Aquila earthquake. The colour polygons represent the damage grade
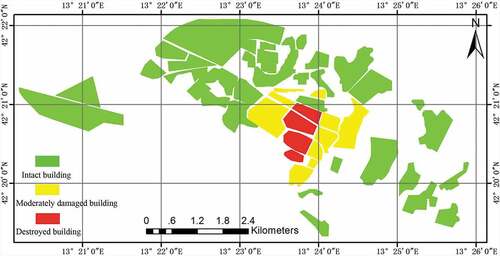
Figure 4. Technical scheme of the proposed method
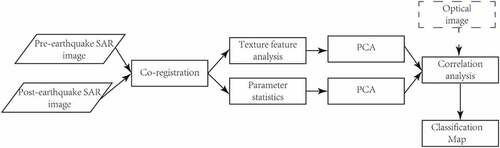
Figure 5. Evolution of variance in relation to window size for textural measures
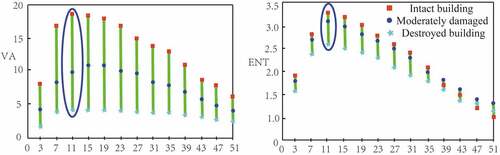
Figure 6. Statistical distribution of SAR image characteristic parameters of different types of building. For improved clarity, the scale of the values is enlarged by a factor of 10
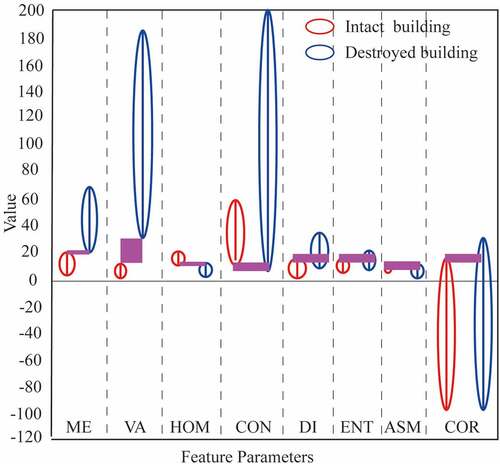
Figure 7. The first PC of texture features of ME, VA, and HOM: (a) before and (b) after the earthquake
Figure 8. The relationship between the correlation threshold and damage grade
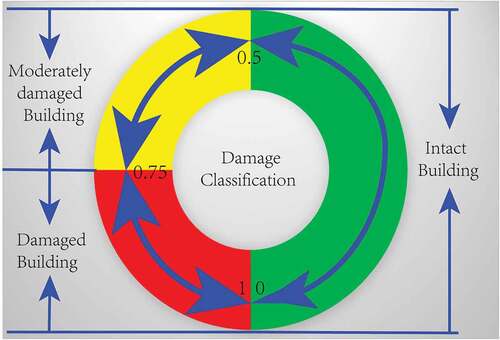
Figure 9. Distribution map of earthquake damage using the PTFCCD method. The extraction results are masked by building area
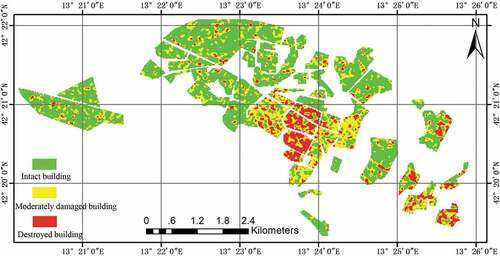
Figure 10. Distribution map of earthquake damage using the STFCCD method. The discrete pixels in the result are processed by merging
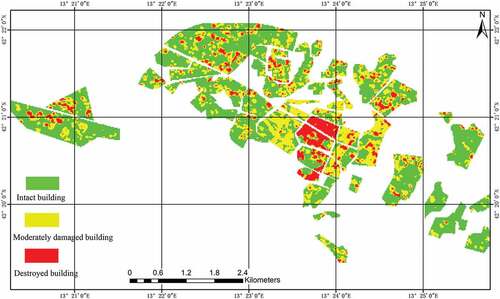
Figure 11. Distribution map of earthquake damage using the ICCD method. The discrete pixels in the result are processed by merging
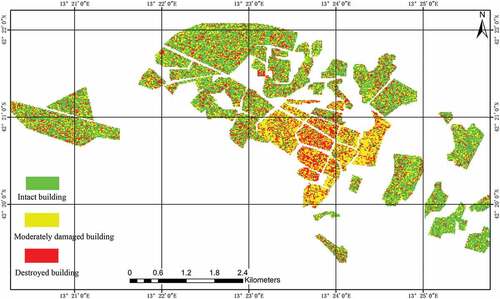
Figure 12. Distribution map of earthquake damage using the ISCD method
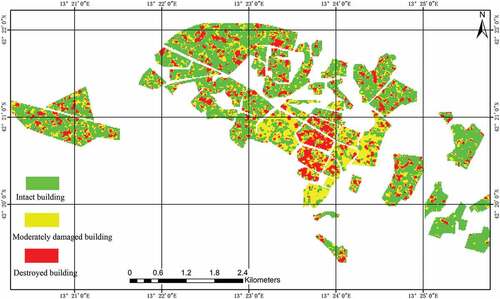
Figure 13. Distribution map of earthquake damage using the TFSCD method
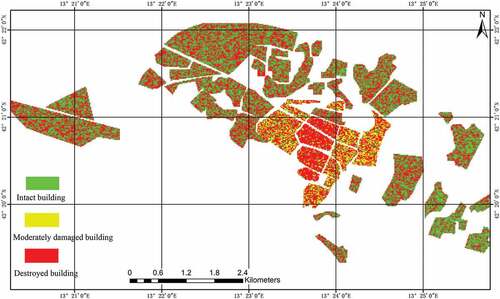
Table 2. Accuracy measures for the CCD methods. For details on the accuracy measures (EA, MR, FDR), see the main text
Table 3. Accuracy measures for the SCD methods. For details on the accuracy measures (EA, MR, FDR), see the main text