Figures & data
Figure 1. Flowchart of Gaussian (Gl) and Laplacian pyramid (Ll)
Figure 2. Block diagram of LP-based change detection
Table
Table 1. Quality measures for speckle reduction assessment
Table 2. Performance of various datasets using SSIM, ENL and SSI
Figure 3. Experimental results of various dataset (a1) Athabasca image with marginal on 330th row, (a2) Image profile beside on 330th row of original image, (a3) Image profile beside on 330th row of despeckled image, (b1) Alberta image with marginal on 33rd row, (b2) Image profile beside on 33rd row of original image, (b3) Image profile beside on 33rd row of despeckled image, (c1) Aare image with marginal on 67th row, (c2) Image profile beside on 67th row of original image, (c3) Image profile beside on 67th row of despeckled image
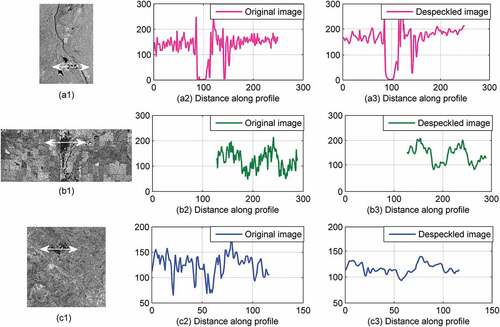
Figure 4. Experimental results on LP-based multiscale decomposition combined with LR operator. Athabasca dataset (a1) L10−L20, (a2) L11−L21, (a3) L12−L22, (a4) L13−L23 and (a5) Reconstructed image; Aare River dataset (b1) L10−L20, (b2) L11−L21, (b3) L12−L22, (b4) L13−L23 and (b5) Reconstructed image; Alberta dataset (c1) L10−L20, (c2)) L11−L21, (c3) L12−L22, (c4) L13−L23 and (c5) Reconstructed image
Figure 5. Experimental results of simulated images (a) I1 (b) I2 (c) Ground truth (d) MR (e) LR (f) MRKI (g) LRKI (h) MRO (i) LRO (j) FMLKI (k) FMLO (l) LPCD
Figure 6. Experimental results of Athabasca Dataset (a) I1 (b) I2 (c) Ground truth (d) MR (e) LR (f) MRKI (g) LRKI (h) MRO (i) LRO (j) FMLKI (k) FMLO (l) LPCD
Figure 7. Experimental results of Alberta Dataset (a) I1 (b) I2 (c) Ground truth (d) MR (e) LR (f) MRKI (g) LRKI (h) MRO (i) LRO (j) FMLKI (k) FMLO (l) LPCD
Figure 8. Experimental results of Aare River Dataset (a) I1; (b) I2; (c) Ground truth; (d) MR; (e) LR; (f) MRKI; (g) LRKI; (h) MRO; (i) LRO; (j) FMLKI; (k) FMLO; (l) LPCD
Table 3. Evaluation of change detection for simulated images with different methods
Table 4. Evaluation of change detection for Athabasca oil sand dataset with different methods
Table 5. Evaluation of change detection for Alberta flood dataset with different methods
Table 6. Evaluation of change detection for Aare River dataset with different methods
Figure 9. Comparison Result of PCC for: (a) Athabasca dataset, (b) Alberta dataset, (c) Aare River dataset; Comparison Result of Kappa Coefficient for: (d) Athabasca dataset, (e) Alberta dataset, (f) Aare River dataset
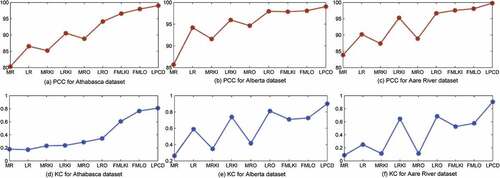
Table 7. Comparison of different multiscale methods
Figure 10. Experiment results of comparison with multiscale methods (a) SDA (b) KL-MCP (c) BA-MCD (d) K matrix-MS (e) Proposed LPCD method
Figure 11. Otsu thresholding results: Vs gray level (a) Athabasca image, (b) Alberta image, (c) Aare river image; Histogram with threshold values: (a) Athabasca image, (b) Alberta image, (c) Aare river image
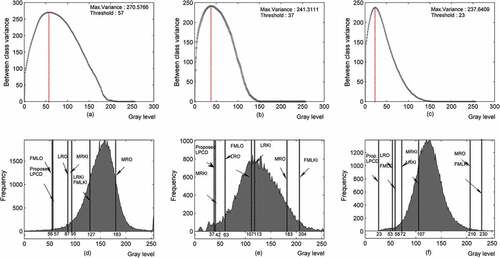
Figure 12. Experiment results of Alberta dataset for Otsu thresholding (a) (b)
Table 8. Experimental results for small percentage of changed pixels
Table 9. Area overlap measure (AOM) for Otsu thresholding for different between class variance value in values.
Figure 13. Otsu segmentation result for Athabasca image (a) = 124.76; Threshold = 7, (b)
; Threshold = 14, (c)
; Threshold = 27, (d)
; Threshold = 39, (e)
; Threshold = 58, (f)
; Threshold = 88, (g)
; Threshold = 104, (h)
; Threshold = 115, (i)
; Threshold = 126, (j)
; Threshold = 135, (k)
; Threshold = 145, (l)
; Threshold = 154
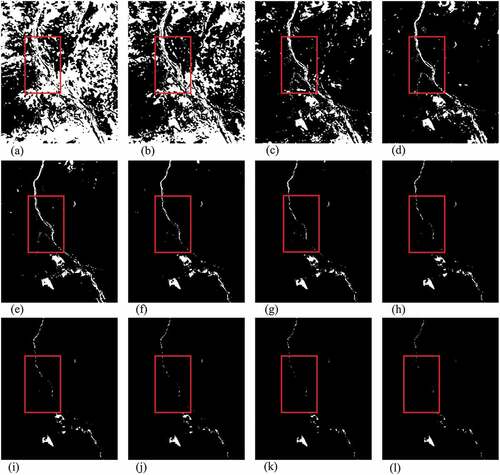
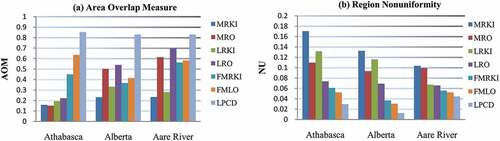
Table 10. Performance measures (region nonuniformity)
Table 11. Performance measures (area overlap measure)
Figure 14. Comparison results of (a) area overlap measure (AOM), (b) region nonuniformity (NU)