Figures & data
Figure 1. The flowchart of this study
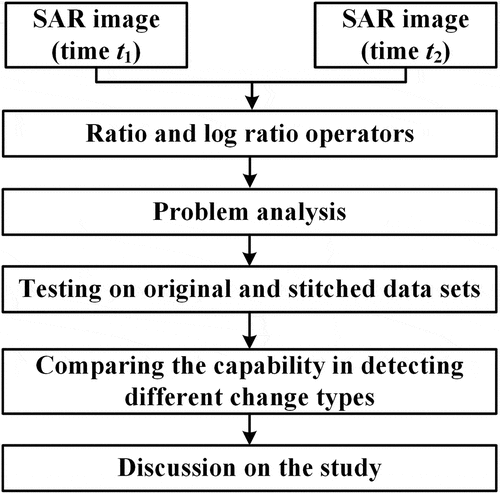
Table 1. List of symbols used in this study
Figure 2. Multi-temporal images acquired by ERS-2 in Berne, Switzerland and their stitched images containing two change types. (a) Image acquired in April 1999. (b) Image acquired in May 1999. (c) Reference map. (d) stitched image acquired at , the left part is the same as Figure 2(a) and the right part is the same as Figure 2(b). (e) Stitched image acquired at
, the left part is the same as Figure 2(b) and the right part is the same as Figure 2(a). (f) Reference map of stitched images
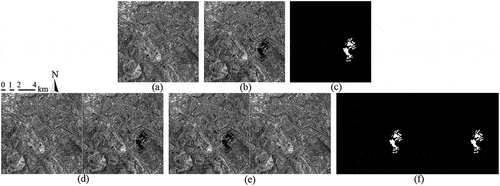
Figure 3. Multi-temporal images acquired by radarsat-1 in Ottawa, Canada and their stitched images containing two change types. (a) Image acquired in May 1997. (b) Image acquired in August 1997. (c) Reference map. (d) stitched image acquired at , the left part is the same as Figure 3(a) and the right part is the same as Figure 3(b). (e) Stitched image acquired at
, the left part is the same as Figure 3(b) and the right part is the same as Figure 3(a). (f) Reference map of stitched images
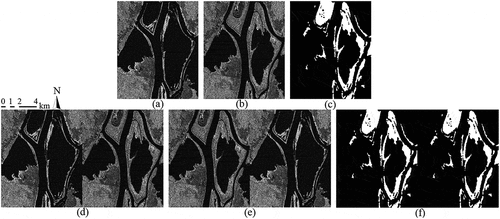
Figure 4. Multi-temporal images acquired by radarsat-2 in FengFeng, China and their stitched images containing two change types. (a) Image acquired in April 2015. (b) Image acquired in March 2016. (c) Reference map. (d) Stitched image acquired at , the left part is the same as Figure 4 (a) and the right part is the same as Figure 4(b). (e) Stitched image acquired at
, the left part is the same as Figure 4(b) and the right part is the same as Figure 4(a). (f) Reference map of stitched images
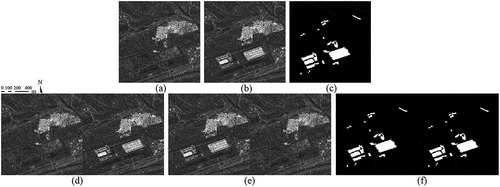
Figure 5. Difference images generated from Berne data set by using (a) IR, (b) LIR, (c) OLR, and (d) ILR
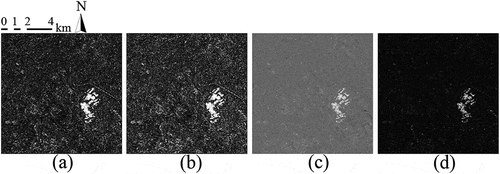
Figure 6. Difference images generated from Ottawa data set by using (a) IR, (b) LIR, (c) OLR, and (d) ILR
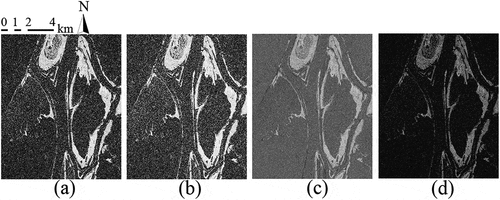
Figure 7. Difference images generated from FengFeng data set by using (a) IR, (b) LIR, (c) OLR, and (d) ILR
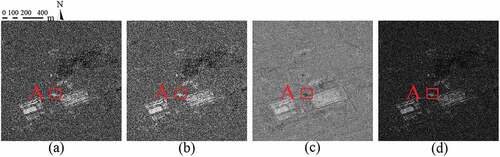
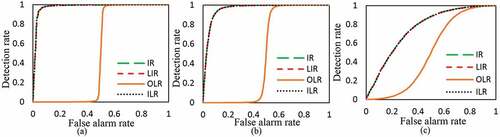
Figure 8. ROC curves of the difference images generated with IR, LIR, OLR, and ILR in original (a) Berne, (b) Ottawa, and (c) FengFeng data sets
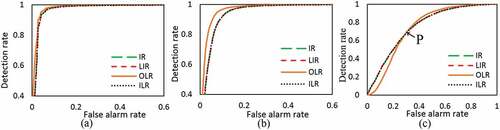
Figure 9. Difference images generated from stitched FengFeng data set by using (a) IR, (b) LIR, (c) OLR, and (d) ILR
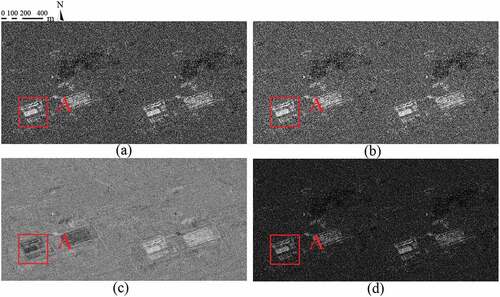
Figure 10. ROC curves of the difference images generated with IR, LIR, OLR, and ILR in stitched (a) Berne, (b) Ottawa, and (c) FengFeng data sets