
Figures & data
Figure 1. Protected agriculture in Mexico, number of hectares (ha) per municipality for the entire country. Own elaboration based on the data from SIAP (Citation2015)
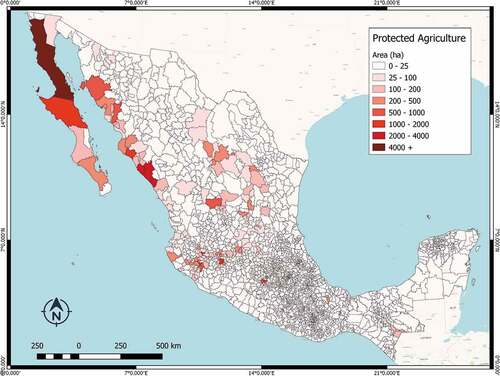
Table 1. Description of the computed indexes using Sentinel-2 band information. The abbreviations refer to the spectral bands: NIR near-infrared, SWIR short wave infrared, RED, GREEN and BLUE are the bands in the visible parts of the spectrum
Figure 2. Plasticulture in the region between Patzcuaro and Morelia cities, as shown in the bottom left box, both panels display the composite one-year Sentinel-2 image. (a) Bare composite image, the bright white pixels are the plastic films of PA infrastructures. (b) highlighted in red are shown the areas that were detected as PA by our classifier (these vectors are not the ones made by visual interpretation)
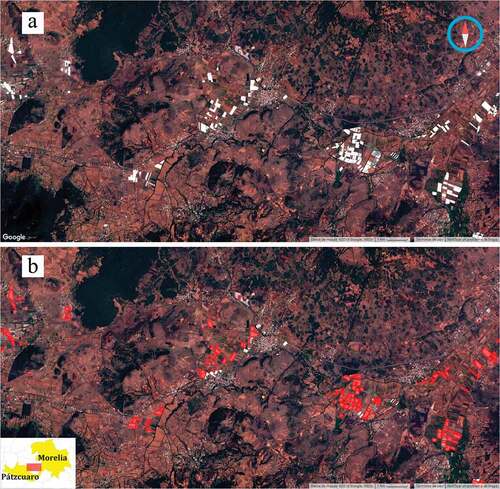
Figure 3. Protected Agriculture in the State of Sinaloa, according to this study. Location of all plasticulture infrastructures on the national territory, and number of hectares per municipality
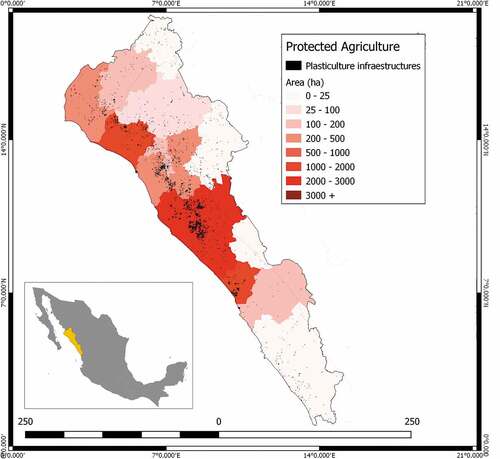
Table 2. Raw confusion matrix
Figure 4. Frequency Histogram of the differences between estimates. The X axis is the difference between SIAP and ours municipal PA area estimations in ha while the Y axis is the frequency in the logarithmic scale. Most municipalities have a difference of less than 100 ha, and differences of more than 400 ha are very rare
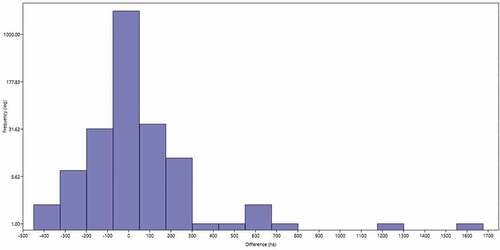
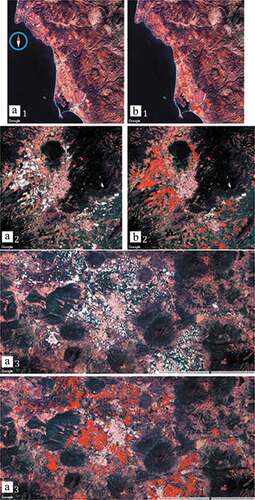
Figure 5. Plasticulture Infrastructure in different windows of three municipalities with a large PA area. All windows contain two panels: A and B; panel A contains the Sentinel colour composite, where the plasticulture infrastructure is easily discernible, panel B contains the same composite image as background, and an additional layer in bright red which shows the polygons classified as PA. The windows correspond to the following municipalities: 1) Ensenada, Baja California State; 2) Zapotlan, Jalisco; and 3) Zamora, Michoacan
Data availability statement
The corresponding shapefile and metadata produced as a result of this study can be found at http://lae.ciga.unam.mx/recursos/Agricultura_Protegida_2018.rar