
Figures & data
Figure 1. Heavy metal contents in corn leaves (O, M, N) stressed by different (a) Cu concentrations and (b) Pb concentrations
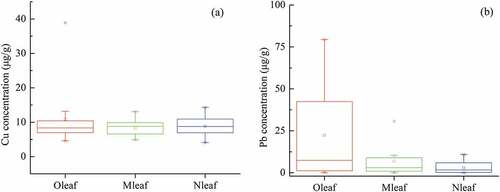
Figure 2. Correlation coefficients between Cu content in leaves of different development degrees and (a) reflectance and (b) first difference reflectance
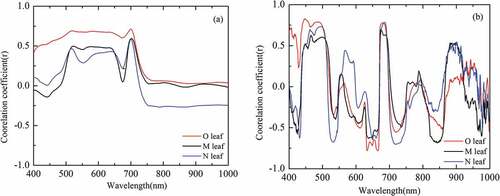
Figure 3. Correlation coefficients between Cu content in leaves of different development degrees and first difference reflectance of the mean spectrum
Figure 4. Correlation coefficients between Pb content in leaves of different development degrees and (a) reflectance and (b) first difference reflectance
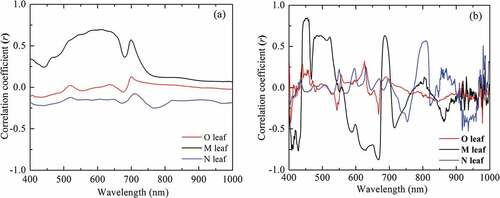
Figure 5. Correlation coefficients of the first difference reflectance and heavy metal contents in leaves under (a) Cu stress and (b) Pb stress
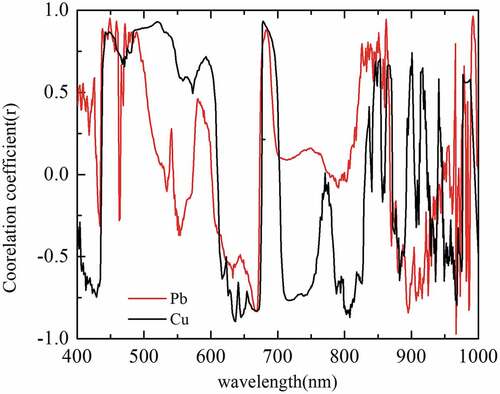
Table 1. Results of regression analysis of dVI and heavy metal content in corn leaves under Cu case
Table 2. Results of regression analysis of dVI and heavy metal content in corn leaves under Pb case
Figure 6. Results of regression analysis of dVI and heavy metal contents in leaves under the Cu case from “Zhongnuo No.1” corn in the years 2014 2016
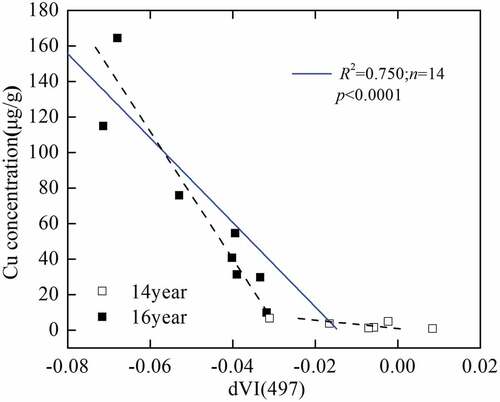
Table 3. Results of regression of published indices and heavy metal content in the corn leaves under the Cu case and Pb case
Table 4. The absolute value of Pearson correlation coefficient (r) between Pb contents in leaves and VIs (“Zhongnuo No.1” corn in the year 2014)