Figures & data
Figure 1. Map of the sites of interest (source: own creation, ESRI data)
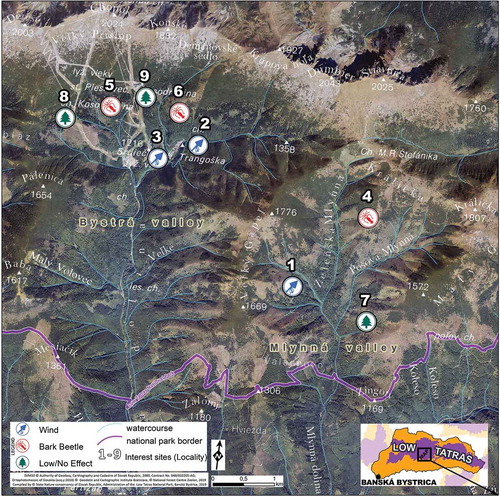
Table 1. List of the used images (source: USGS)
Table 2. Description of the sites of interest (source: NAPANT)
Figure 2. The development of the individual monitored indices for the locality 1 affected by wind disturbance (red vertical line is the time of wind disturbance and blue line is the start of recovery mode) (source: own creation)
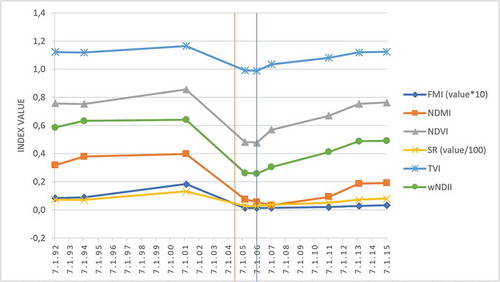
Figure 3. The development of the individual monitored indices for the locality 2 affected by wind disturbance (red vertical line is the time of wind disturbance and blue line is the start of recovery mode) (source: own creation)
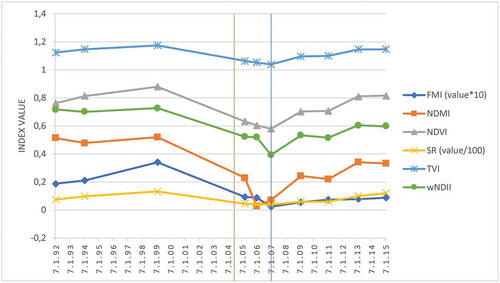
Figure 4. The development of the individual monitored indices for the locality 3 affected by wind disturbance (red vertical line is the time of wind disturbance and blue line is the start of recovery mode) (source: own creation)
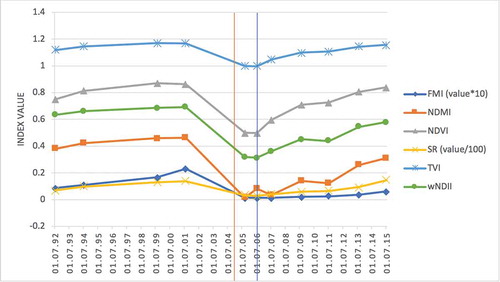
Figure 5. The development of the individual monitored indices for the locality 4 affected by bark beetle disturbance (red vertical line is the start of bark beetle disturbance and blue line is the start of recovery mode) (source: own creation)
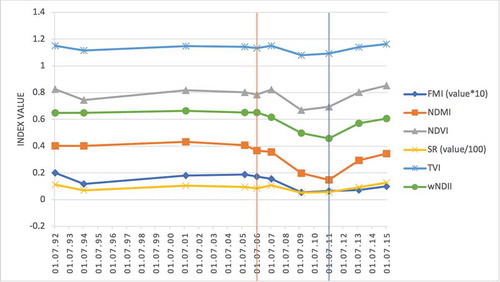
Figure 6. The development of the individual monitored indices for the locality 5 affected by bark beetle disturbance (red vertical line is the start of bark beetle disturbance and blue line is the start of recovery mode) (source: own creation)
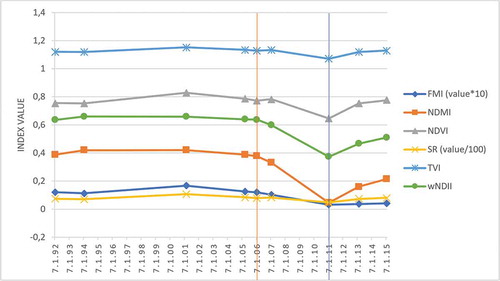
Figure 7. The development of the individual monitored indices for the locality 6 affected by bark beetle disturbance (red vertical line is the start of bark beetle disturbance and blue line is the start of recovery mode) (source: own creation)
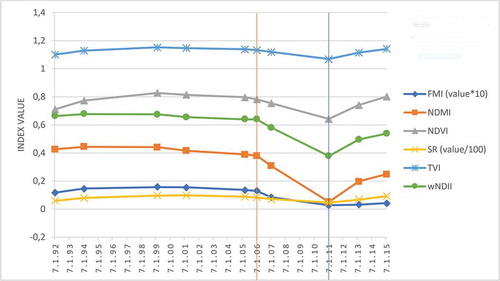
Figure 8. The development of the individual monitored indices for the locality 7 without disturbance (source: own creation)
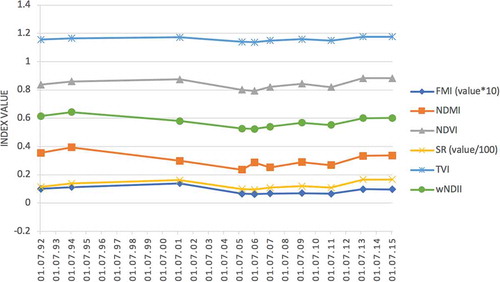
Figure 9. The development of the individual monitored indices for the locality 8 without disturbance (source: own creation)
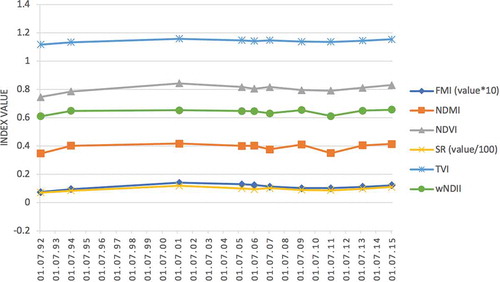
Figure 10. The development of the individual monitored indices for the locality 9 without disturbance (source: own creation)
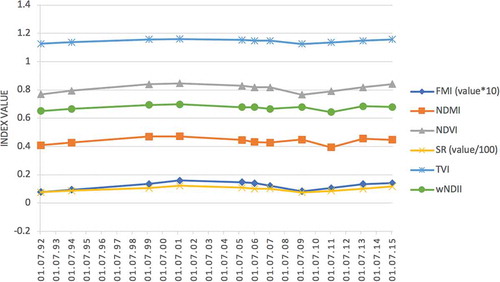
Table 3. Description of the locality 1 (source: LGIS National Forest Center, GIS S-NAPANT)
Figure 11. Aerial photographs of the locality 1 from years 2005, 2009 and 2018 (source: NAPANT, own creation)
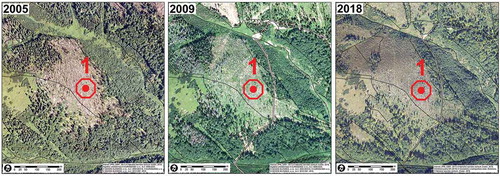
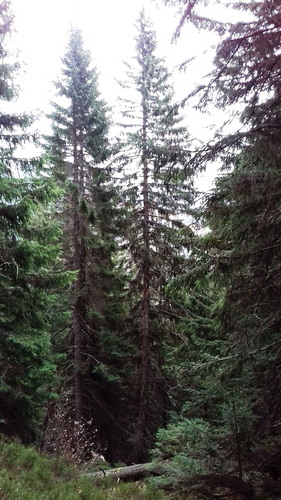
Figure 12. Photo of the locality 1 (source: own creation)
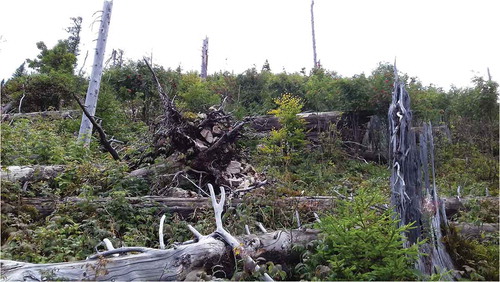
Table 4. Description of the locality 2 (source: LGIS National Forest Center, GIS S-NAPANT)
Figure 13. Aerial photographs of the locality 2 from years 2005, 2009 and 2018 (source: NAPANT, own creation)
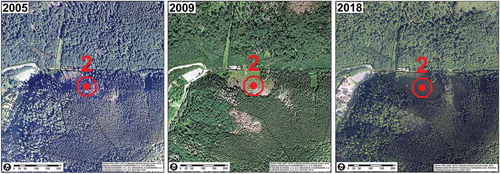
Figure 14. Photo of the locality 2 (source: own creation)
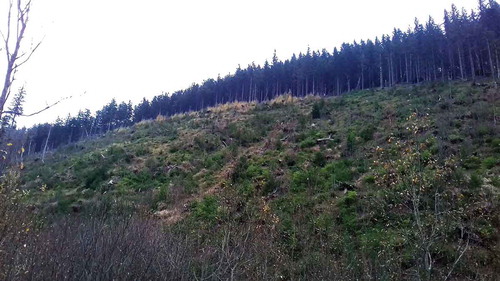
Table 5. Description of the locality 3 (source: LGIS National Forest Center, GIS S-NAPANT)
Figure 15. Aerial photographs of the locality 3 from years 2005, 2009 and 2018 (source: NAPANT, own creation)
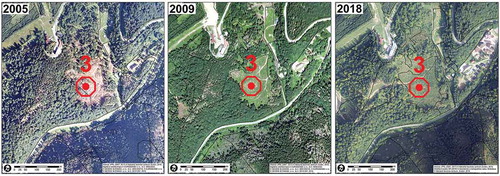
Figure 16. Photo of the locality 3 (source: own creation)
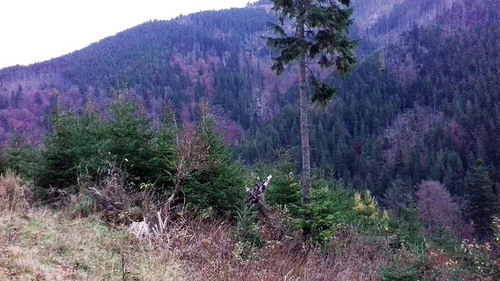
Table 6. Description of the locality 4 (source: LGIS National Forest Center, GIS S-NAPANT)
Figure 17. Aerial photographs of the locality 4 from years 2005, 2009 and 2018 (source: NAPANT, own creation)
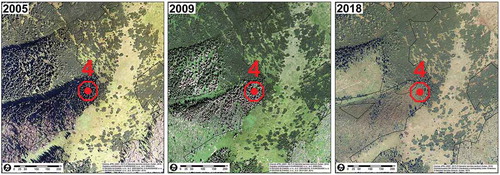
Figure 18. Photo of the locality 4 (source: own creation)
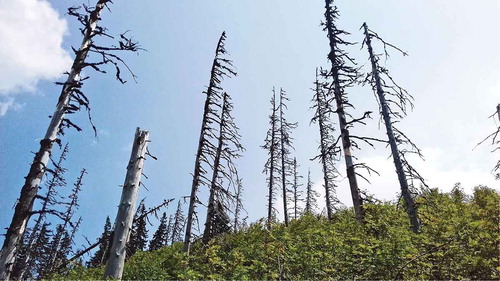
Table 7. Description of the locality 5 (source: LGIS National Forest Center, GIS S-NAPANT)
Figure 19. Aerial photographs of the locality 5 from years 2005, 2009 and 2018 (source: NAPANT, own creation)
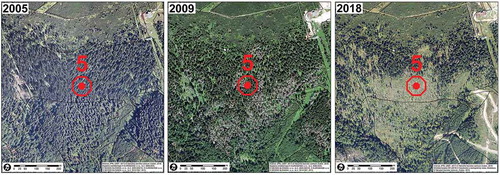
Figure 20. Photo of the locality 5 (source: own creation)
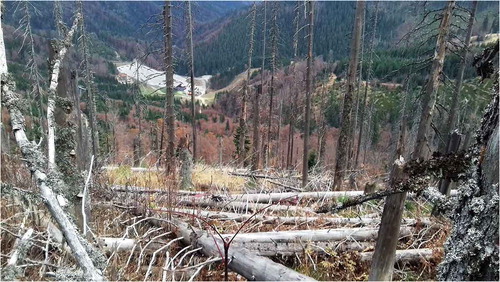
Table 8. Description of the locality 6 (source: LGIS National Forest Center, GIS S-NAPANT)
Figure 21. Aerial photographs of the locality 6 from years 2005, 2009 and 2018 (source: NAPANT, own creation)
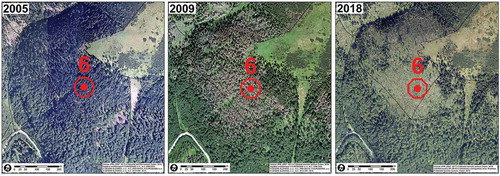
Figure 22. Photo of the locality 6 (source: own creation)
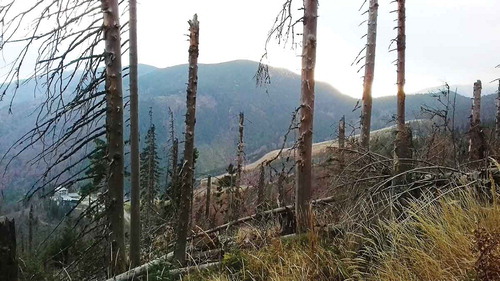
Table 9. Description of the locality 7 (source: LGIS National Forest Center, GIS S-NAPANT)
Figure 23. Aerial photographs of the locality 7 from years 2005, 2009 and 2018 (source: NAPANT, own creation)
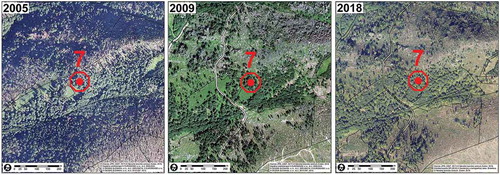
Figure 24. Photo of the locality 7 (source: own creation)
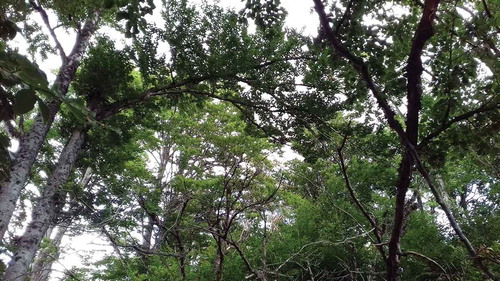
Table 10. Description of the locality 8 (source: LGIS National Forest Center, GIS S-NAPANT)
Figure 25. Aerial photographs of the locality 8 from years 2005, 2009 and 2018 (source: NAPANT, own creation)
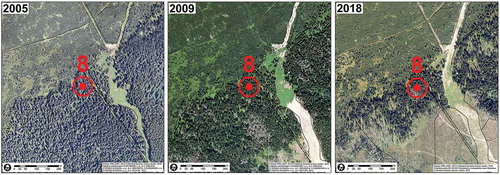
Figure 26. Photo of the locality 8 (source: own creation)
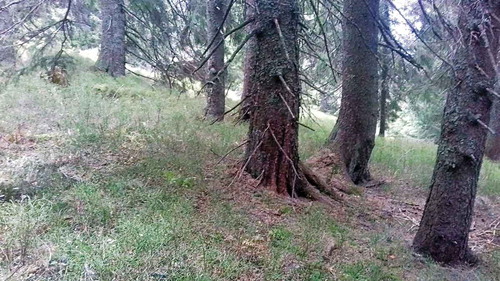
Table 11. Description of the locality 9 (source: LGIS National Forest Center, GIS S-NAPANT)
Figure 27. Aerial photographs of the locality 9 from years 2005, 2009 and 2018 (source: NAPANT, own creation)
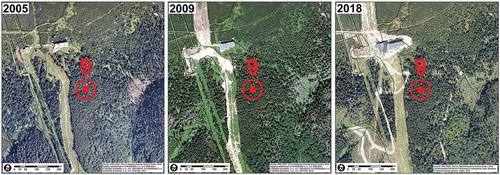
Figure 28. Photo of the locality 9 (source: own creation)