
Figures & data
Table 1. The number of check points that were used in each study area.
Figure 1. Greece and allocation of the ten ALOS PRISM triplets.
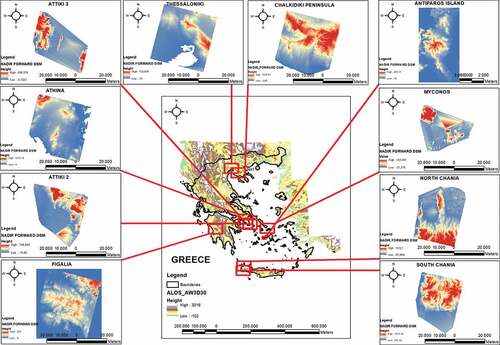
Figure 2. An example of the ALOS PRISM image processing in Leica Photogrammetry Suite.
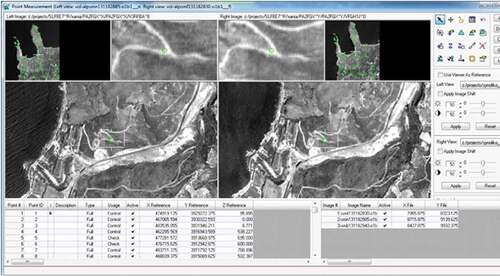
Figure 3. Three examples of the check points that belong to the National Trigonometric Network.
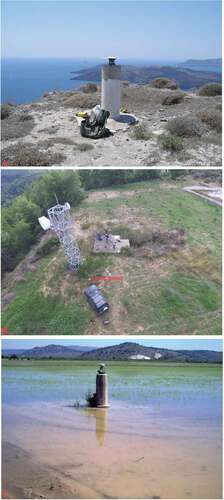
Figure 4. Example of the three DSMs derived from the ALOS triplet. Allocation of the check points over the study area in Chalkidiki Peninula, North Greece.
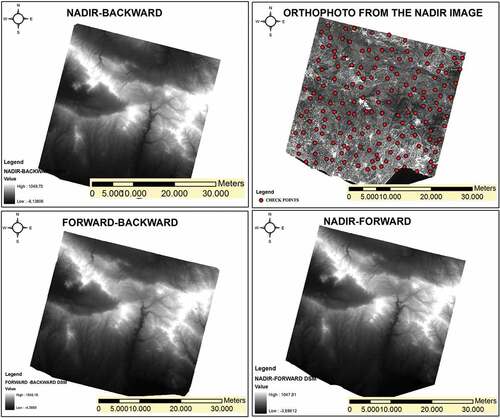
Figure 5. Visual Comparison of the ALOS DSMs and the TOPO50 K DEM over the Chalkidiki Peninsula study area.
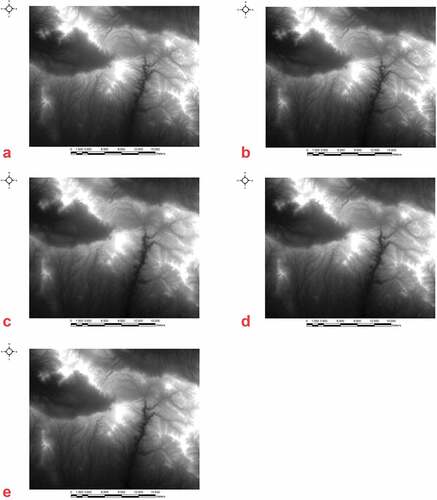
Figure 6. Visual Comparison of the ALOS DSMs and the TOPO50 K DEM over the South Chania study area.
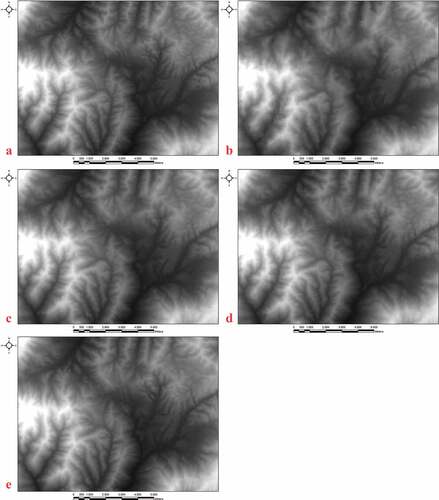
Table 2. Elevation difference between check points and the respective pixels in the DSMs (values in meters) for all the study areas.