
Figures & data
Figure 1. Cooke City dataset with target locations identified by the color squares (left). Plots showing the reference spectra of targets (right). The greyscale image (a), and the targets (b-h)
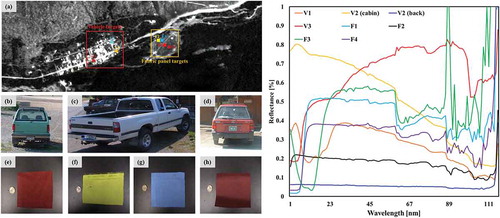
Figure 2. Overview of the proposed method
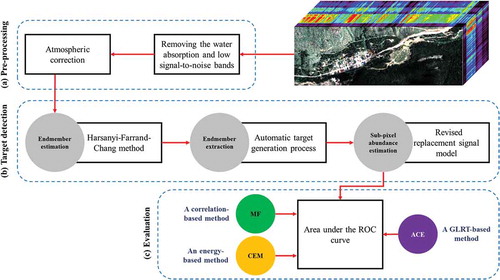
Figure 3. Examples of the greyscale images for bad band 63 (a), and 64 (b)
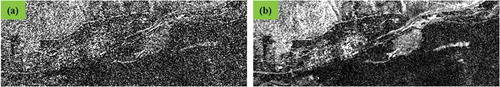
Table 1. The evaluation results for the predicted spectral signature based on the proposed strategy in the Cook City dataset. Good values for R2 and RMSE are 100%, and 0, respectively
Figure 4. Plots showing the reflectance spectra of targets. Blue spectra denote the reference signature, and red spectra denote the prediction signature of V1 (a), V2-cabin (b), V2-back (c), and V3 (d)
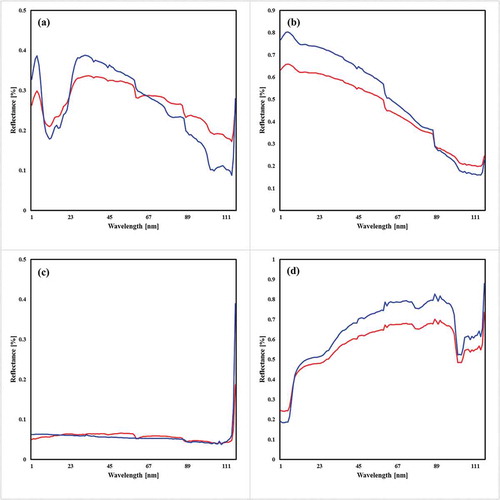
Figure 5. Plots showing the reflectance spectra of targets. Blue spectra denote the reference signature, and red spectra denote the prediction signature of F1 (a), F2 (b), F3 (c), and F4 (d)
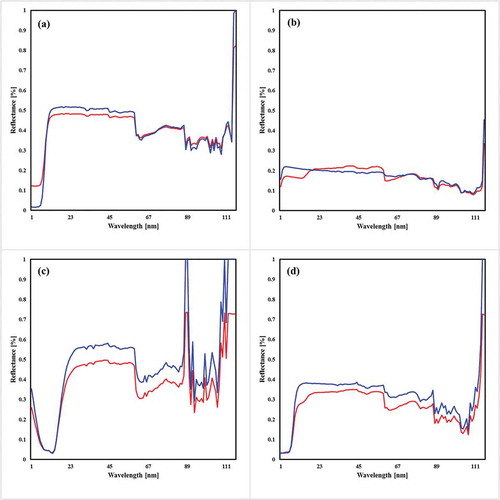
Table 2. Area under the ROC curve for vehicles. The bold values denote the best result
Table 3. Area under the ROC curve for fabric panels. The bold values denote the best result
Figure 6. Results of the first target (V1). The Probability prediction values for target pixels are defined in a range from 0% to 100%
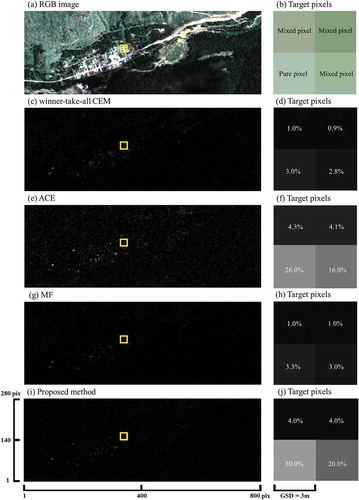
Figure 7. Results of the second target (V2). The Probability prediction values for target pixels are defined in a range from 0% to 100%
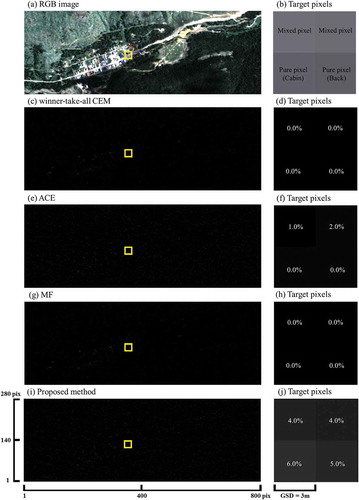
Figure 8. Results of the third target (V3). The Probability prediction values for target pixels are defined in a range from 0% to 100%
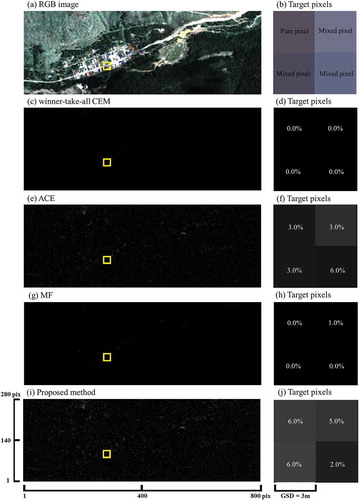
Figure 9. Results of the fourth target (F1). The Probability prediction values for target pixels are defined in a range from 0% to 100%
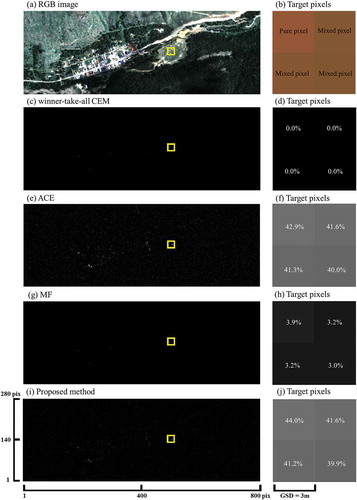
Figure 10. Results of the fifth target (F2). The Probability prediction values for target pixels are defined in a range from 0% to 100%
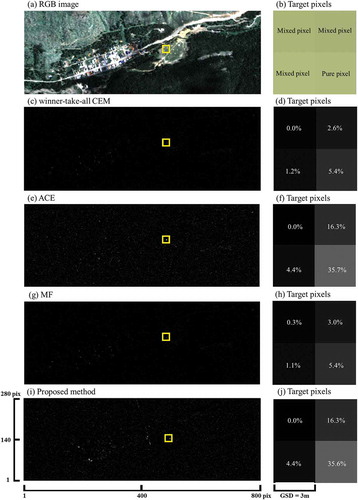
Figure 11. Results of the sixth target (F3). The Probability prediction values for target pixels are defined in a range from 0% to 100%
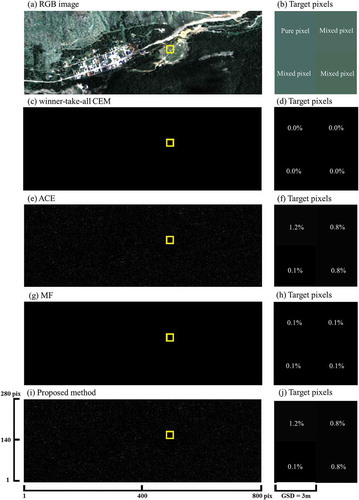
Figure 12. Results of the seventh target (F4). The Probability prediction values for target pixels are defined in a range from 0% to 100%
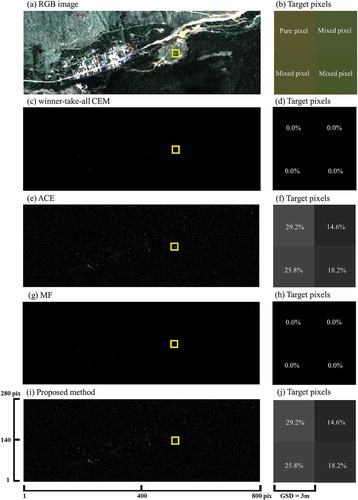
Table 4. A comparison between probability prediction values in the proposed approach and the state-of-the-art methods for different targets. The bold values denote the best result
Table