
Figures & data
Figure 1. Allocation of diverse studies areas regarding the application of remote sensing technology in shoreline evolution mapping
Table 1. Researchers’ whose interest about time interval (n) of shoreline monitoring was n ≤ 10 years
Table 2. Researchers’ whose interest about time interval (n) of shoreline monitoring was 10 < n ≤ 30 years
Table 3. Researchers’ whose interest about time interval (n) of shoreline monitoring was 30 < n ≤ 70 years
Table 4. Researchers’ whose interest about time interval (n) of shoreline monitoring was n ≥ 70 years
Figure 2. Flow chart of methodology used to get to meta-analysis review paper

Figure 3. Studies published between 2000 and 2019 being referenced in current paper. Blue line represents the total number of studies
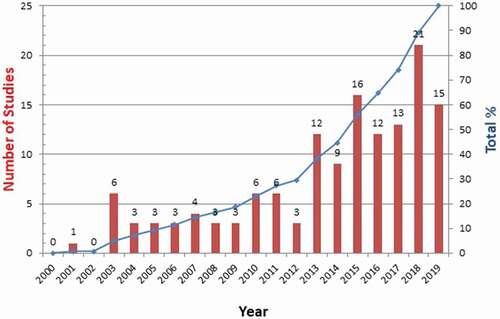
Figure 4. Rates of studies that have been funded
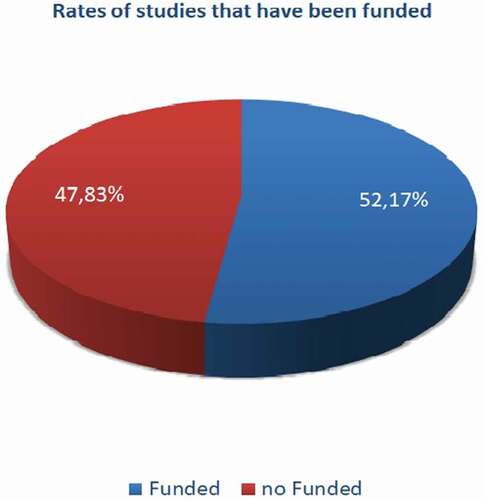
Figure 5. Four categories of periods (n in years) which researches work on; a) n ≤ 10, b) 10 < n ≤ 30, c) 30 < n ≤ 70, d) n > 70
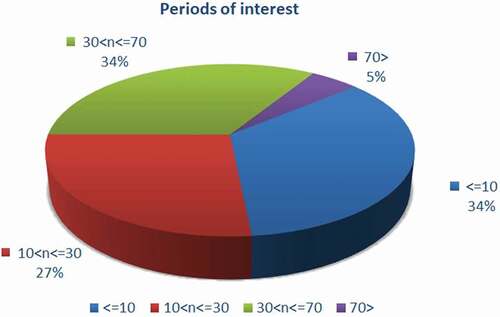
Figure 6. The most common data sources used in shoreline monitoring
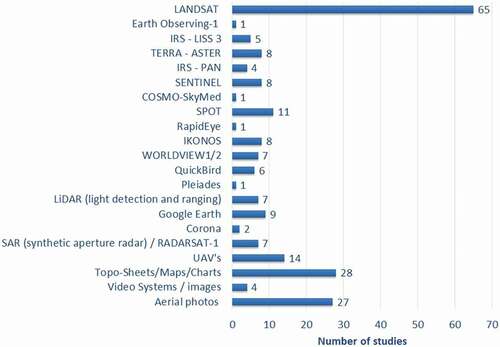
Figure 7. Classification of data in three categories according to spatial resolution
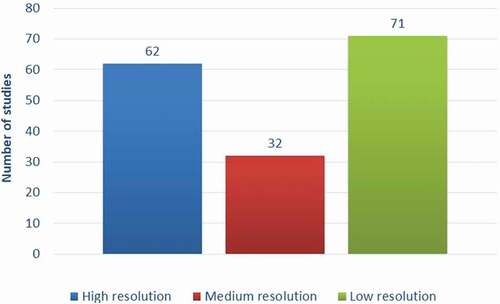
Table 5. Data sources classified by spatial resolution a) High resolution, b) Medium resolution and c) Low resolution
Figure 8. Most common software used in shoreline analysis
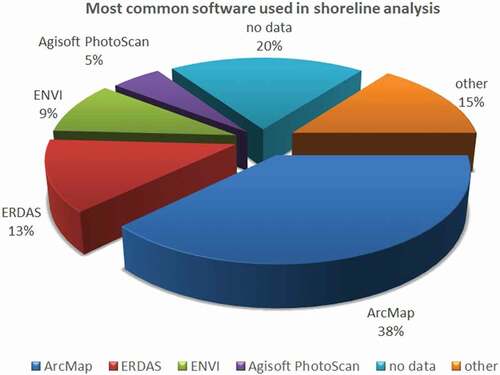
Figure 9. Software with low-frequency appearance in shoreline studies
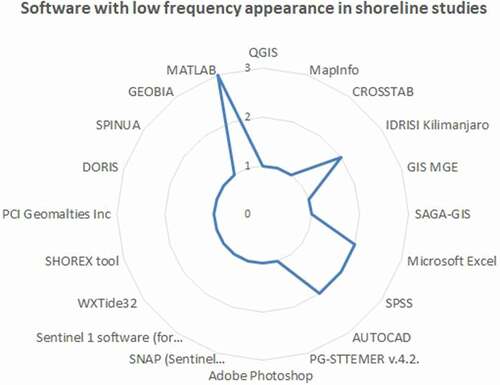
Figure 10. Most used software for UAV’s data processing
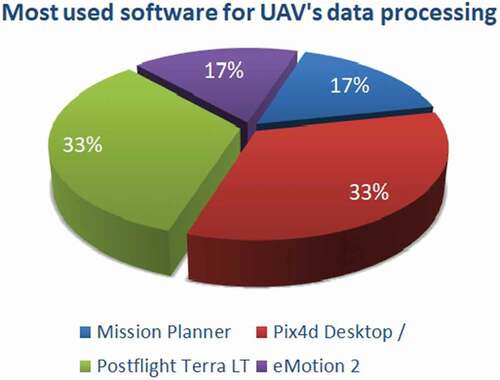
Figure 11. Most common indices for delineation of land/water used among studies. Average High-Water Line (AHWL), Automatic Water Extraction Index (AWEI), Normalized Difference Vegetation Index (NDVI), Normalized Difference Water Index (NDWI), Modified Normalized Difference Water Index (MNDWI), High Water Line (HWL), Land Surface Water Index (LSWI), High Tide Line (HTL), Seaward Dune Vegetation Line (SwDVL), Instantaneous Water Line (IWL), Stable Dune Vegetation Line (StDVL), Low Water Level (LWL), Mean Low Water (MLW)
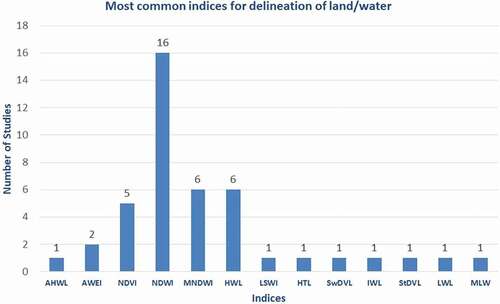
Figure 12. Methods used to determine the shoreline
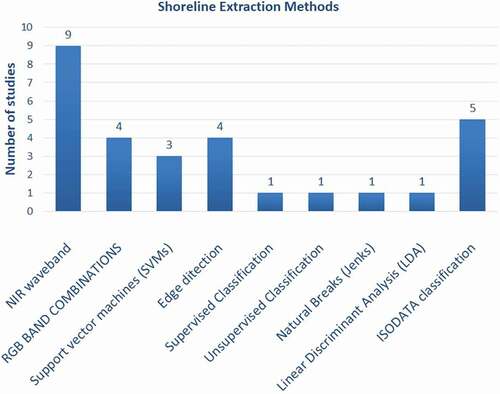
Figure 13. Algorithms and equations used by researchers to delineate the shoreline position
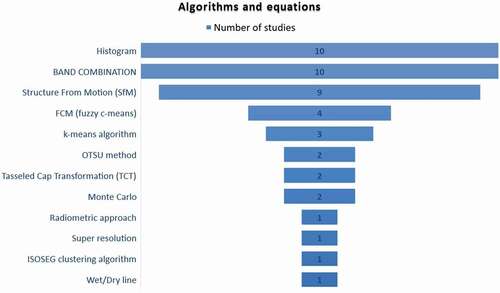
Figure 14. Semi-automatic and manual methods
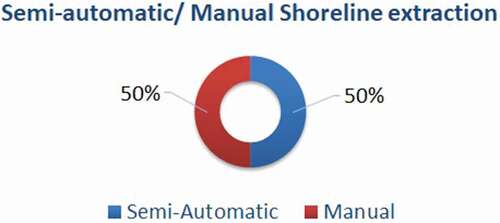
Figure 15. Most common indices of DSAS tool; End Point Rate (EPR), Net Shoreline Movement (NSM), Linear Regression Rate (LRR), Shoreline Change Envelope (SCE), Standard Error of Linear Regression (LSE), Confidence Interval of Linear Regression (LCI), R-squared of Linear Regression (LR2), and Weighted Linear Regression (WLR)
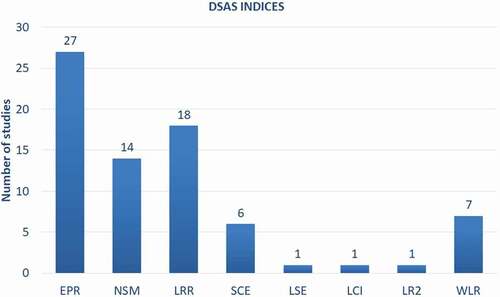
Figure 16. Tool and methods for the calculation of accretion/erosion rates; Annual Erosion Hazard Rate (AEHR), Beach Width (BW), Tracer stick method (TsM), Coastal Vulnerability Index (CVI), Volumetric Changes (VC), Revised Universal Soil Loss Equation (RUSLE), Unit Stream Power – based Erosion Deposition (UPSED)
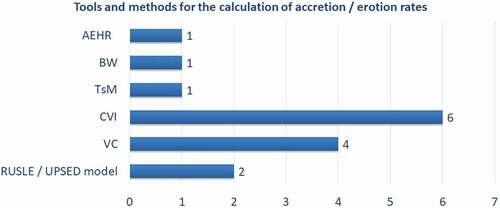
Table 6. Top 10 cited articles in Scopus in the present study literature