Figures & data
Figure 1. Study area showing the flood-affected districts of West Bengal state
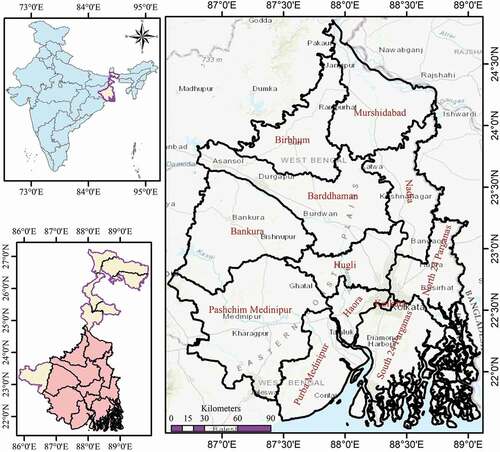
Table 1. Earth Observation images used to analyze the Amphan cyclone event
Figure 2. Methodology showing the flood mapping framework
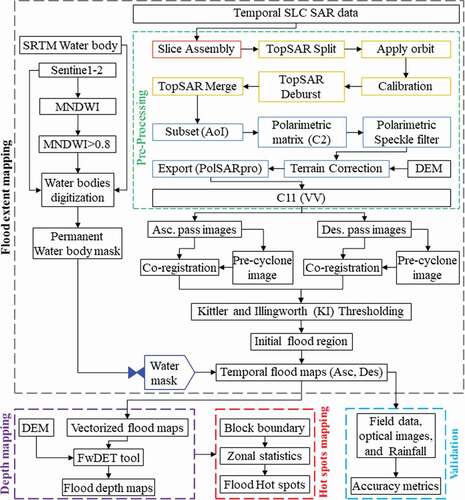
Figure 3. Temporal histograms corresponding to (a)–(f) of radar backscattering σ°vv before and after speckle filtering for the images acquired on 19 May 2020, 22 May 2020, 25 May 2020, 28 May 2020, 31 May 2020 and 3 June 2020 for study area extent
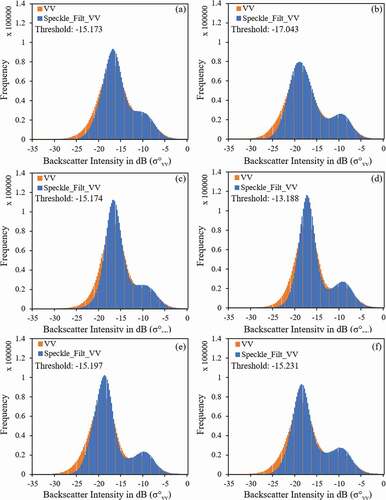
Figure 4. Temporal flood maps of study area extent for the images acquired on 16 May 2020, 19 May 2020, 22 May 2020, 25 May 2020, 28 May 2020, 31 May 2020 and 3 June 2020 corresponding to sub-figures (c)–(i). Sub-figures (a) and (b) show the SAR image acquired on 01 April and 4 April 2020
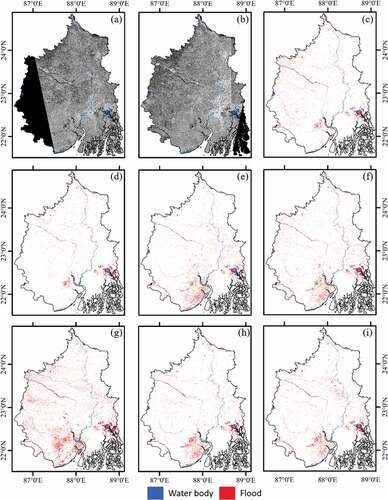
Figure 5. District wise quantitative estimation of temporal flood area
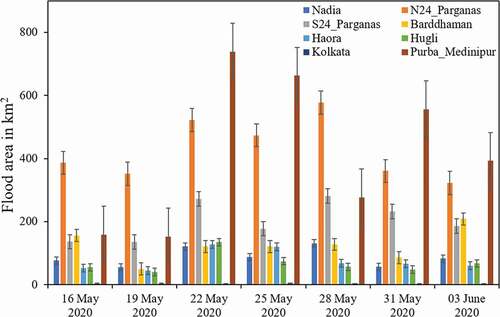
Figure 6. Temporal histograms of radar backscattering σ°vv before and after speckle filtering for the images acquired on 19 May 2020, 22 May 2020, 25 May 2020, 28 May 2020, 31 May 2020 and 3 June 2020 corresponding to (a)–(f) for Purba Medinipur district
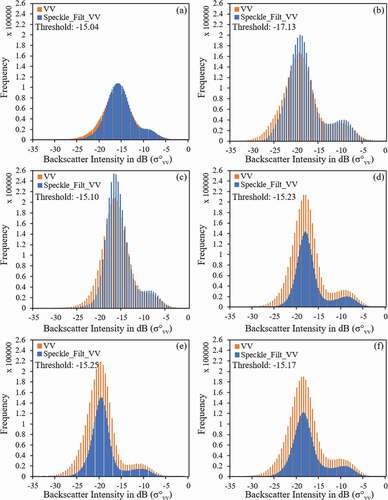
Figure 7. Temporal flood maps of Purba Medinipur district for the images acquired on 16 May 2020, 19 May 2020, 22 May 2020, 25 May 2020, 28 May 2020, 31 May 2020 and 3 June 2020 corresponding to sub-figures (c)–(i). The sub-figures (a), (b) shows the SAR image acquired on 01 April and 4 April 2020
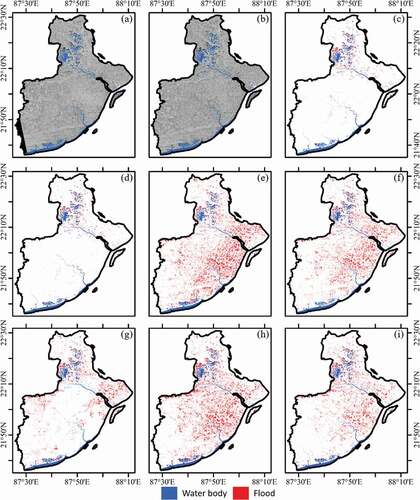
Figure 8. Spatio-temporal flood depth maps of Purba Medinipur district for the images acquired on 16 May 2020, 19 May 2020, 22 May 2020, 25 May 2020, 28 May 2020, 31 May 2020 and 3 June 2020 corresponding to sub-figures (a)–(g). Sub-figure (h) shows the ALOS PALSAR DEM
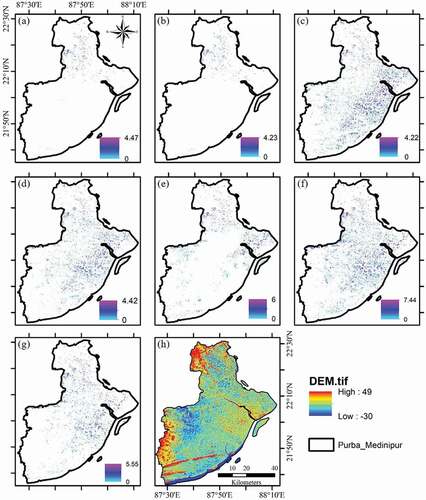
Figure 9. Spatio-temporal flood hot spots of Purba Medinipur on 16 May 2020, 19 May 2020, 22 May 2020, 25 May 2020, 28 May 2020, 31 May 2020 and 3 June 2020 corresponding to sub-figures (b)–(i). Sub-figure (a) represents the village boundaries
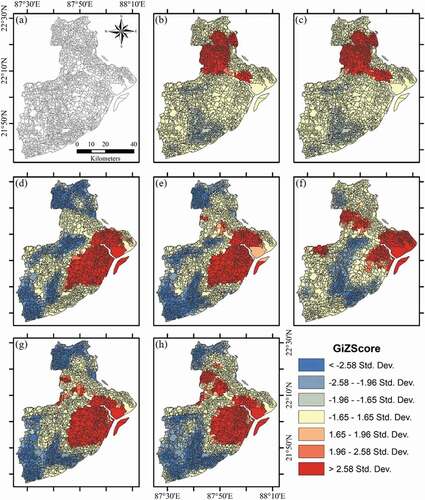
Figure 10. Sentinel-2 optical images acquired before (9 May 2020) and after (29 May 2020) the cyclone. Sub-figures (a) and (b) are the true colour composites and (b), (d) are the MNDWI thematic indices
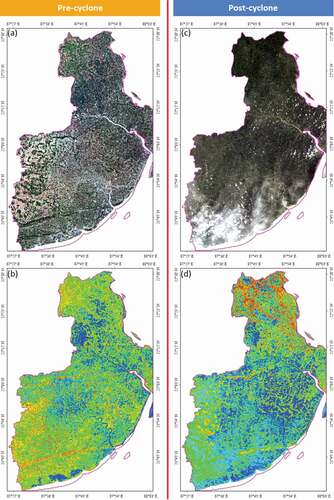
Figure 11. Validation data generated from Sentinel-2 optical image acquired on 29 May 2020 and the field survey data
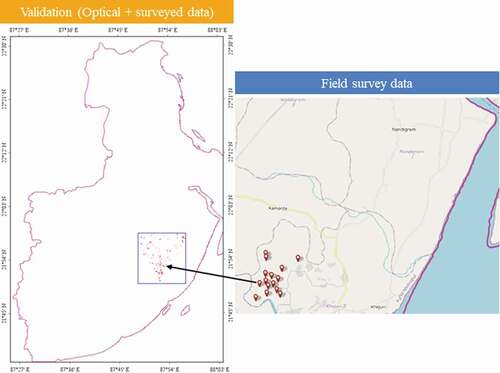
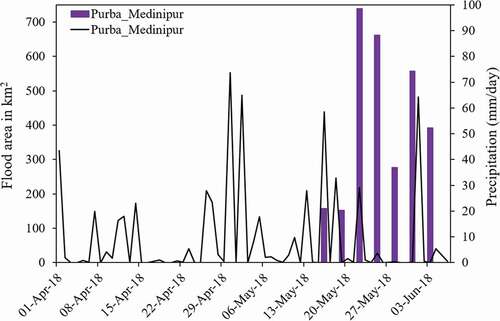
Figure 12. District level temporal flood area is plotted against the spatially averaged IMERG rainfall for 16 May 2020, 19 May 2020, 22 May 2020, 25 May 2020, 28 May 2020, 31 May 2020, and 3 June 2020