
Figures & data
Figure 1. Location of the test study area: greater gaborone planning area (GGPA) (reprinted with permission from Y. Ouma et al. (Citation2022). Copyright 2022 ISPRS archives).
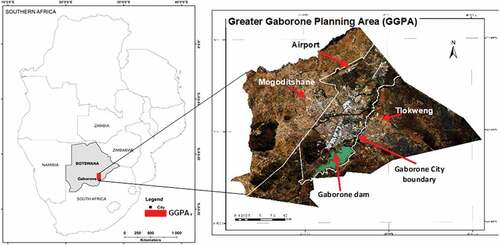
Table 1. Characteristics of Landsat MSS, TM, ETM+ and Landsat OLI sensors.
Figure 2. False color composite LULC classes and the spectral reflectances in L8-OLI (part of figure reprinted with permission from Y. Ouma et al. (Citation2022). Copyright 2022 ISPRS archives).
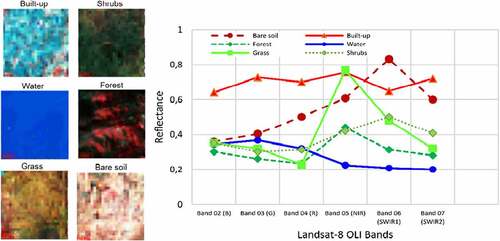
Figure 3. Visualizing gradient tree decision boosting (reprinted with permission from Y. Ouma et al. (Citation2022). Copyright 2022 ISPRS archives).
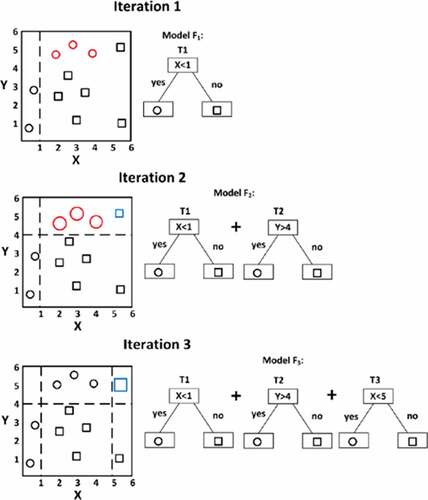
Figure 4. Illustration of the random forest classification structure.
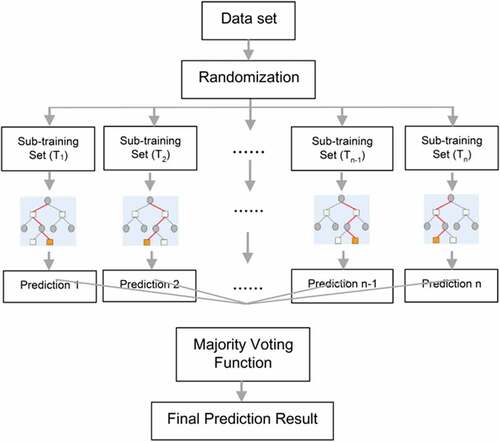
Figure 5. Maximum margin-minimum norm classifier in support vector machine with optimal hyperplane for linearly non-separable classes (reprinted with permission from Y. Ouma et al. (Citation2022). Copyright 2022 ISPRS archives).
Figure 6. Topology of a three-layer MLP-ANN.
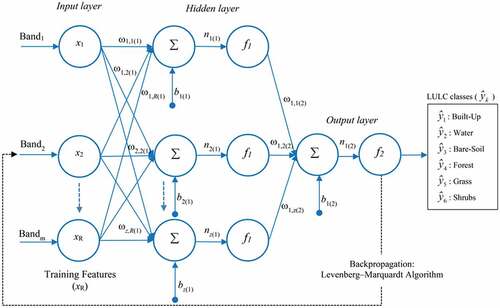
Figure 7. The feature in-feature out (FEI-FEO) fusion for post-classification fusion.
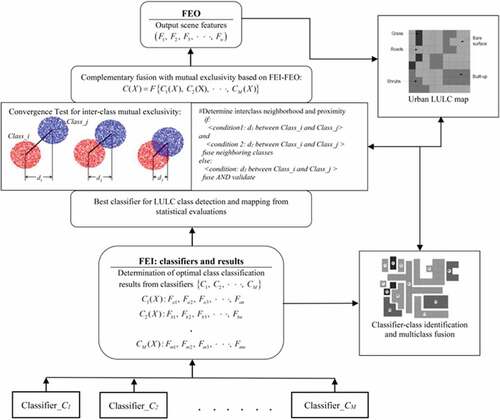
Figure 8. Variation of number of training samples and classifier overall average accuracy.
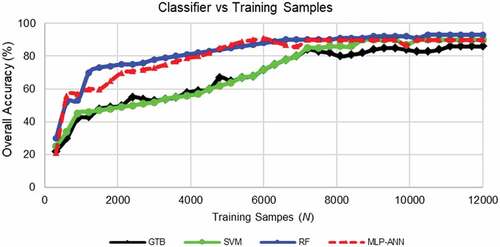
Figure 9. Average yearly PA and UA metrics for LULC classes.
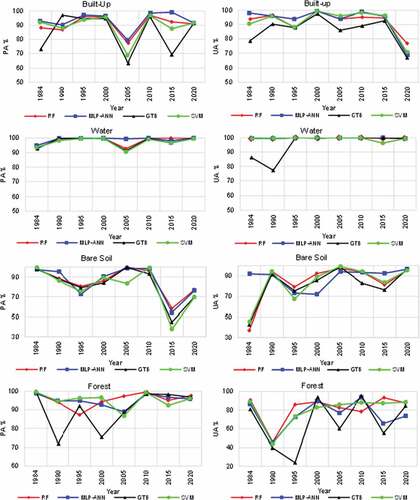
Table 2. Classifier-class average accuracy.
Figure 10. Average ROC curves for the classifiers.
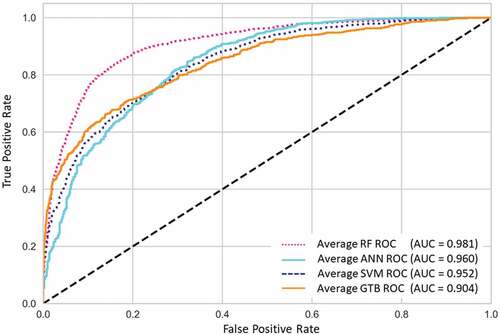
Figure 11. Classifier-class-year F1-scores.
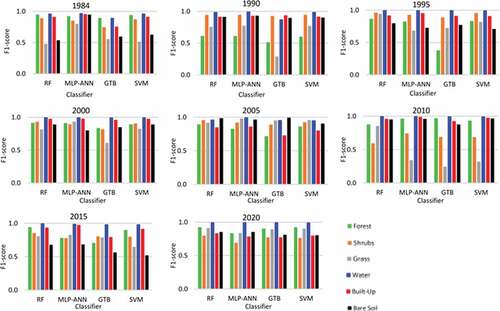
Figure 12. Average overall accuracy performance of the classifiers and the FEI-FEO fusion.
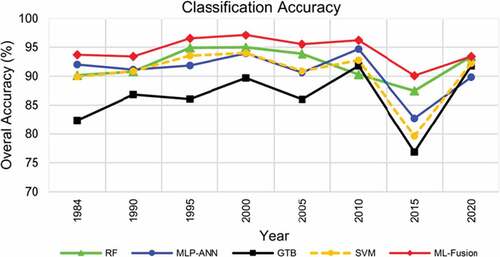
Table 3. Average kappa coefficients for the classifiers per year.
Table 4. Average z-scores and p-values for ML model pairs.
Figure 13. LULC year-class areas and change detection using GTB, RF, SVM and MLP-ANN.
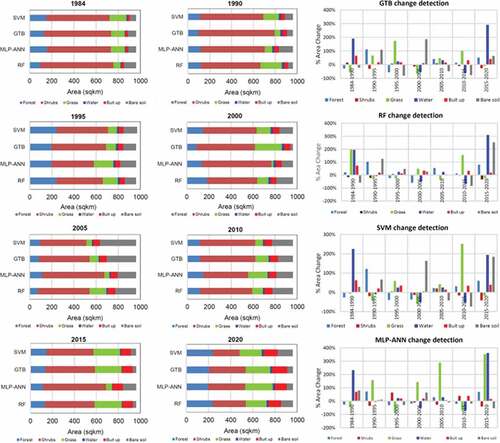
Figure 14. Multiclass FEI-FEO post classification fusion.
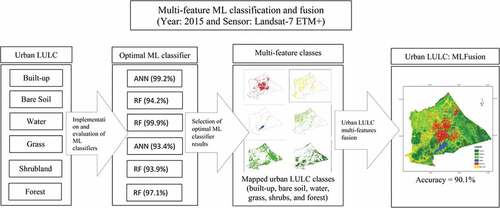
Figure 15. Image-based ground-truth comparison of classification results for different LULC classes and at different locations within the study area for 2020 (reprinted with permission from Y. Ouma et al. (Citation2022). Copyright 2022 ISPRS archives).
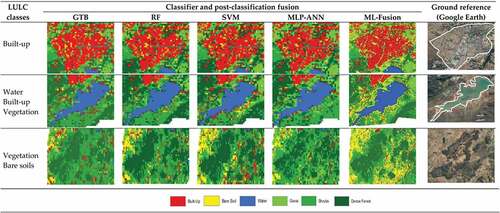
Table 5. Summary of best class classifier per year.
Data availability statement
The data used in this study was obtained from the United States Geological Survey (USGS): https://earthexplorer.usgs.gov/. The rest of the data are as presented in this paper. The image data classification was carried out within the Google Earth Engine (GEE).