
Figures & data
Figure 1. Location of analysed districts, districts included in the ProSavana program, the renewed railway, and its stations. Source of base map: Earthstar Geographics.
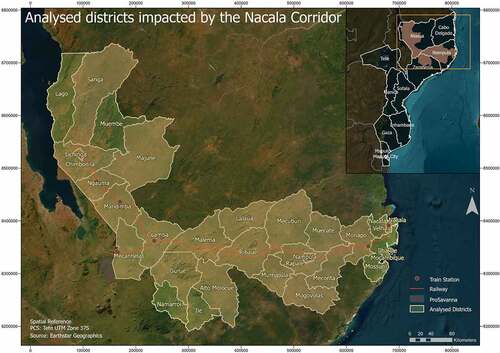
Figure 2. Summary of the operational description of SDI and land grabbing adopted in this research.
Figure 3. Workflow indicating the main steps of this research, indicating by each method the data preparation, the spatial and temporal analysis, and the where the results were integrated.
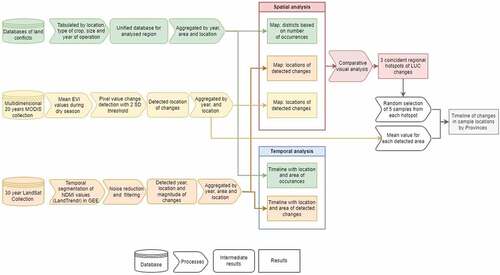
Figure 4. Reported crop types by districts and coloured grouped by provinces. Source: author’s compilation of open databases, 2023.
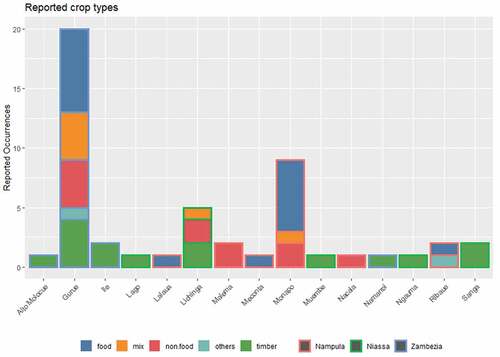
Figure 5. Location of land conflict occurrences aggregated by districts. Spatial reference: Tete, UTM Zone 37S. Base map source: ESRI, Maxar, Earthstar Geographics, and the GIS user community.
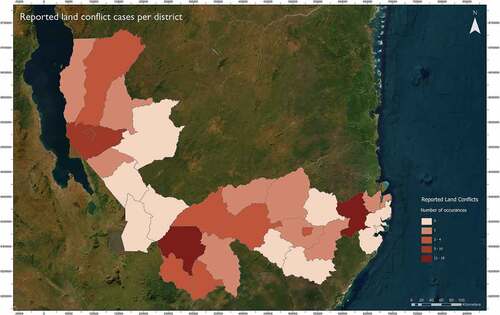
Figure 6. Reported and detected hectares by district based on the NDMI abrupt change detection and reported cases.
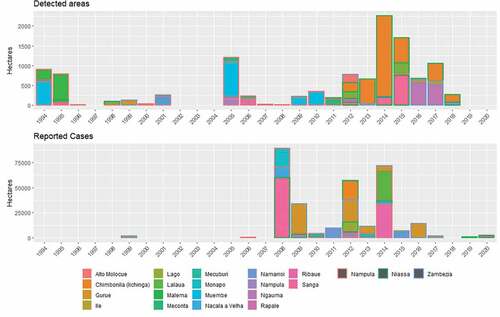
Figure 7. Location of hotspots detected that coincide in three main areas of analysis: (a) Detections resulted from LandTrendr algorithm with NDMI extracted from landsat imagery; (b) Detections resulted from MODIS EVI time-series subtraction. Spatial reference: Tete, UTM Zone 37S. Base map source: ESRI, Maxar, Earthstar Geographics, and the GIS user community.
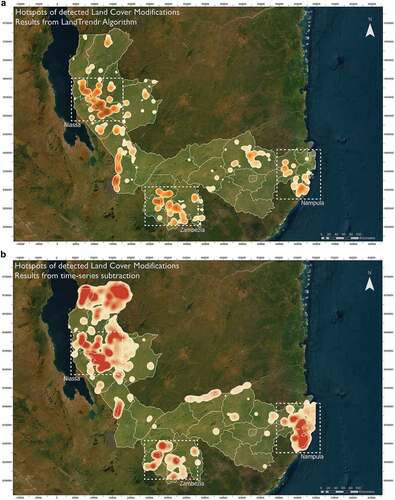
Figure 8. Variation of EVI levels in sample areas detected in each hotspot.
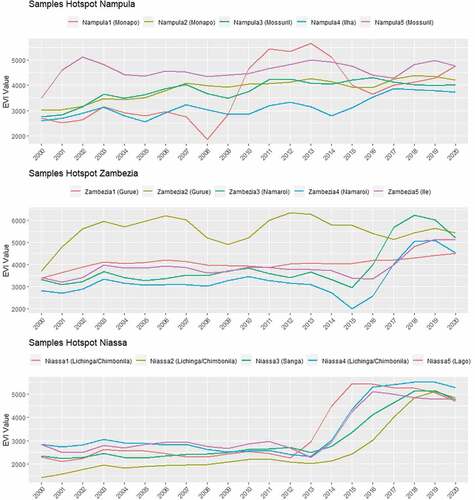
Figure 9. Commodity prices time series. Scale: Index units. Source: Primary Commodity Price System (PCPS) from http://data.imf.org.
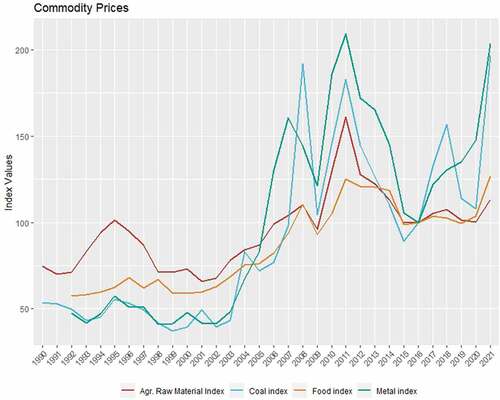
Figure 10. Timeline of most impactful events on regional, national, and global levels.
Data availability statement
Data regarding land conflicts were extracted from Land Matrix (https://landmatrix.org/) and Environmental Justice Atlas (https://ejatlas.org/), other sources were mentioned in the body of the text. Every image collection was accessed via open-sourced databases. Specific data used in the research as well as partial results can be shared upon request.