
Figures & data
Figure 1. Anatomical micrographs of cross sections of studied tree and shrub species with macroscopic leaf photos placed in the left of the cross section. Group 1: TB – temperate broadleaved species in the first row (Acer campestre L., Acer platanoides L., Carpinus betulus L., Corylus maxima L., Quercus robur L. and Tilia euchlora C. Koch). Group two: FXB – Ficus xeromorphic broadleaved species (Ficus benjamina L., Ficus lyrata Warb. And Ficus triangularis L.). Group tree: RXB – Rhododendron xeromorphic broadleaved species. The line segment in lower left corner corresponds to 100 µm in all cross sections presented; the macro photos of green leaves are presented without its actual scale. Light microscopy, bright field, stained with toluidine blue.
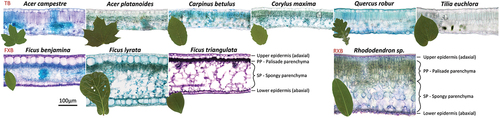
Table 1. Summary of descriptive statistics for all biophysical traits per species.
Table 2. Statistical parameters of partial least squares regression (PLSR) for studied leaf traits. The models were derived using the BCRF from the upper (adaxial) and lower (abaxial) leaf sides using the measurements from all functional groups and species together.
Data availability statement
The data presented in this study are available on reasonable request from the corresponding author.