Figures & data
Figure 1. Three-dimensional view of one of the study fields.
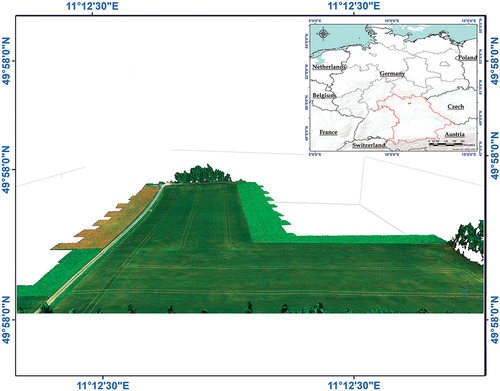
Table 1. Plot characteristics.
Figure 2. Methodological steps for wheat yield estimation based on UAV.
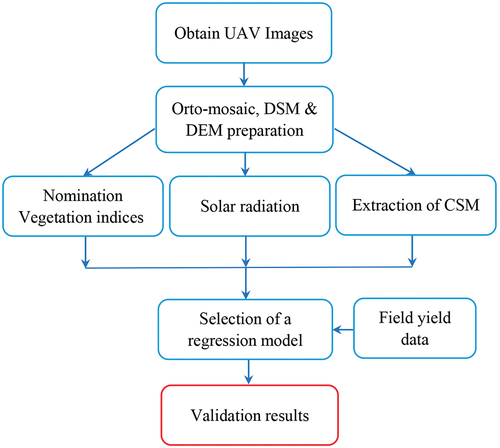
Figure 3. Multi rotor UAV.
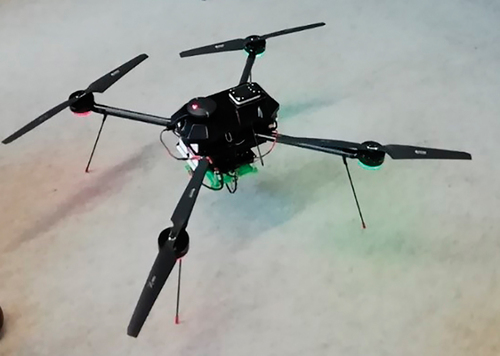
Figure 4. RedEdge-MX camera.
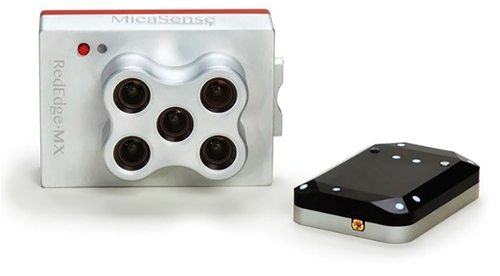
Table 2. Spectral wavelength information of the RedEdge-MX camera.
Figure 5. Wheat yield map compiled from combine harvester machine.
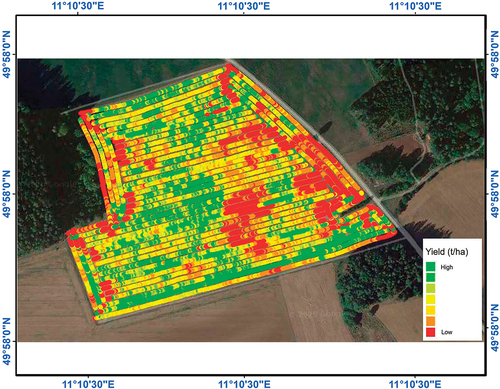
Figure 6. Crop height for the wheat growing season.
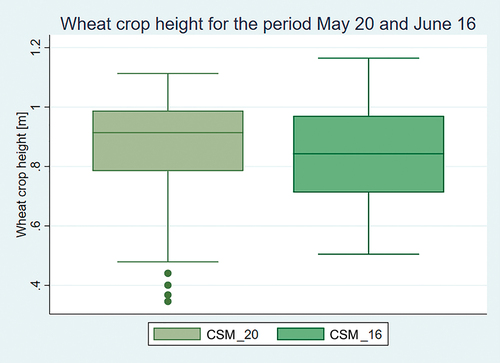
Table 3. Selection vegetation indices equation and their application using UAV bands.
Table 4. Definitions and equations of precision evaluation metrics used in this study.
Figure 7. Results of the multiple and linear regression models a) R2 and b) RMSE.
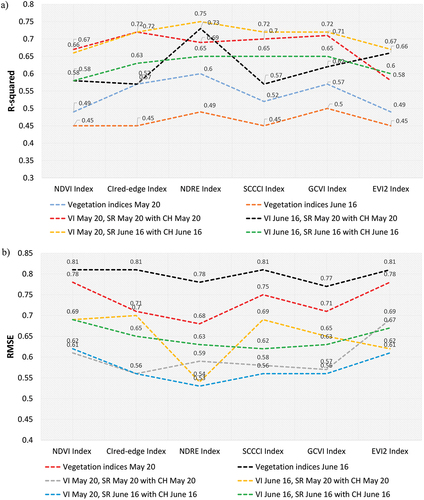
Table 5. Validation results MLR between actual wheat yield data and combined NDREMay20, SRJune16 with CHJune16.
Figure 8. Results of the quantile regression model.
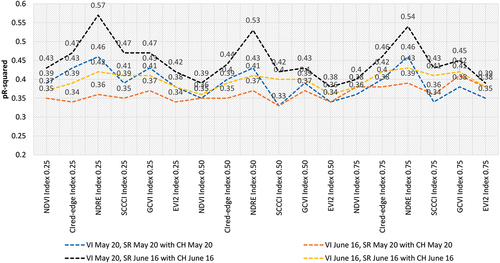
Table 6. Quantile regression result between actual wheat yield data and combined NDREMay20, SRJune16 with CHJune16.
Figure 9. Estimated coefficients with 95% confidence intervals for NDREMay20 , SRJune16 and CHJune16.
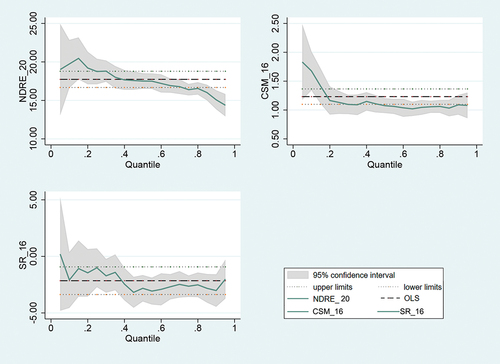
Figure 10. a) comparison of model-predicted wheat yield with actual yield; b) scatter plot of predicted wheat yield with actual yield.
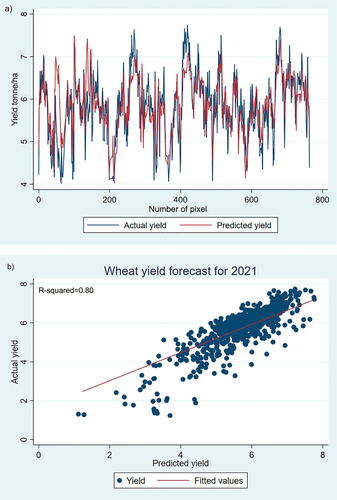
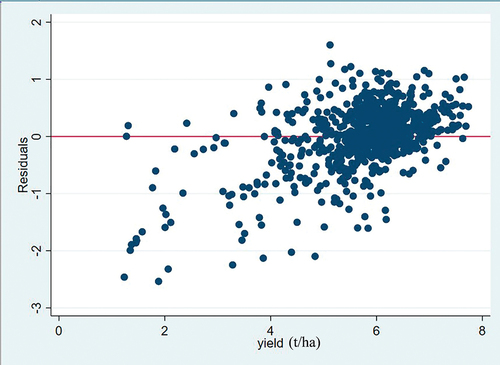
Figure 11. MLR model residuals plot.