
Figures & data
Figure 1. a) study area in the Italian peninsula and elevation map of the Region Basilicata. The red line indicates the administrative limits of the region, b) distribution of the dominant forest class at 1 × 1 km spatial resolution.
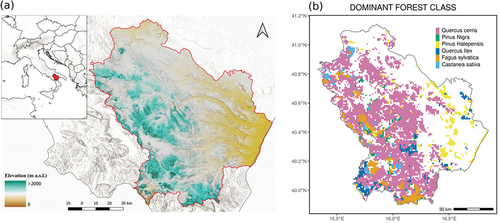
Figure 2. 3D-CMCC-FEM mean annual GPP values (gC m−2 yr−1) for the period 2005–2019 at 1 km spatial resolution. White areas indicate areas not simulated by the 3D-CMCC-FEM.
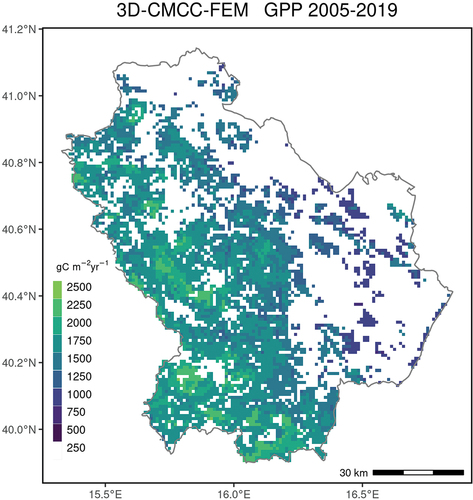
Table 1. Spatial comparison of the 3D-CMCC-FEM GPP vs. RS – based GPP. RMSE= root mean square error (gC m−2 yr−1), RD = relative difference (%), SPAEF = SPatial EFficiency, r = Pearson’s correlation. DJF, winter months; MAM, spring months, JJA, summer months; SON, autumn months. In bold values with the best agreement between 3D-CMCC-FEM GPP and RS-based GPP.
Figure 3. Root mean square error (RMSE, gC m−2 yr−1) between mean annual 3D-CMCC-FEM GPP (gC m−2 yr−1) and the RS-based GPP: a) 3D-CMCC-FEM GPP vs. GOSIF GPP for the period 2005–2019, b) 3D-CMCC-FEM GPP vs. CFIX GPP for the period 2005–2013, c) 3D-CMCC-FEM GPP vs. FLUXCOM GPP for the period 2005–2015; d) histogram of the relative difference, dashed lines indicate the median value. White areas on the maps indicate areas not simulated by the 3D-CMCC-FEM.
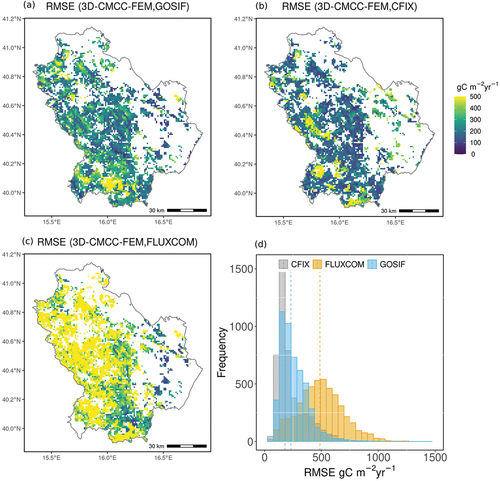
Figure 4. Relative difference (RD, %) between mean annual 3D-CMCC-FEM GPP and the RS-based GPP: a) 3D-CMCC-FEM GPP vs. GOSIF GPP for the period 2005–2019, b) 3D-CMCC-FEM GPP vs. CFIX GPP for the period 2005–2013, c) 3D-CMCC-FEM GPP vs. FLUXCOM GPP for the period 2005–2015; d) histogram of the relative difference, dashed lines indicate the median value. White areas on the maps indicate areas not simulated by the 3D-CMCC-FEM.
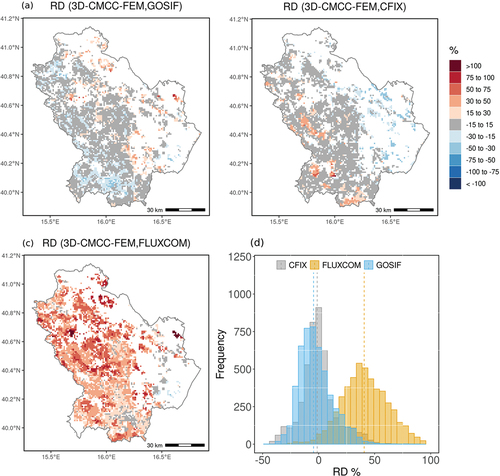
Figure 5. Fractional variance (FV) between mean annual 3D-CMCC-FEM GPP and the RS-based GPP: a) 3D-CMCC-FEM GPP vs. GOSIF GPP for the period 2005–2019, b) 3D-CMCC-FEM GPP vs. CFIX GPP for the period 2005–2013, c) 3D-CMCC-FEM GPP vs. FLUXCOM GPP for the period 2005–2015; d) histogram of the relative difference, dashed lines indicate the median value. White areas on the maps indicate areas not simulated by the 3D-CMCC-FEM.
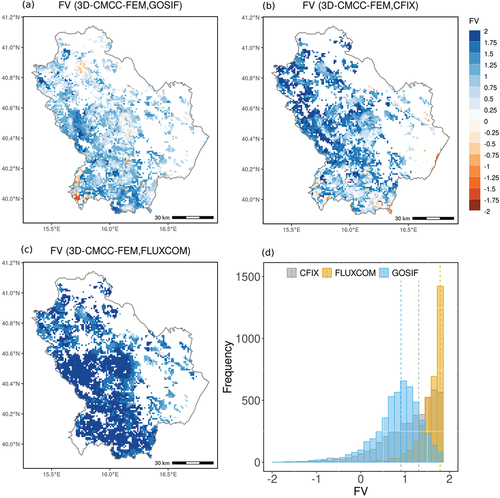
Figure 6. Pearson’s correlation (r) between mean annual 3D-CMCC-FEM GPP and the RS-based GPP: a) 3D-CMCC-FEM GPP vs. GOSIF GPP for the period 2005–2019, b) 3D-CMCC-FEM GPP vs. CFIX GPP for the period 2005–2013, c) 3D-CMCC-FEM GPP vs. FLUXCOM GPP for the period 2005–2015; d) histogram of the relative difference, dashed lines indicate the median value. Grey areas on the maps indicate where correlations are not significant. White areas on the maps indicate areas not simulated by the 3D-CMCC-FEM.
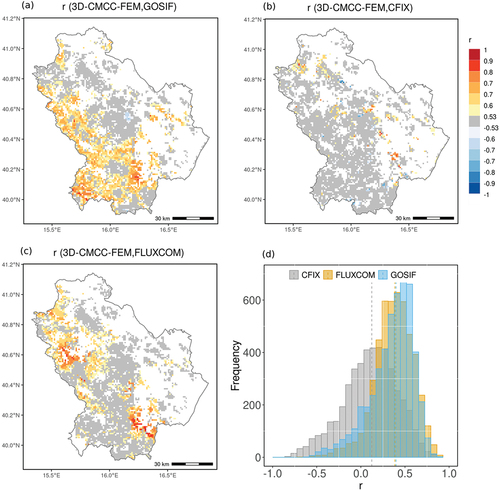
Table 2. Temporal comparison of the 3D-CMCC-FEM GPP vs. RS – based GPP. RMSE= root mean square error (gC m−2 yr−1); RD = relative difference (%); FV = fractional variance; r = Pearson’s correlation. Metrics are first computed at grid cell level and reported as the median value. DJF, winter months; MAM, spring months, JJA, summer months; SON, autumn months; MSC, mean seasonal cycle. In bold values with the best agreement between 3D-CMCC-FEM GPP and RS-based GPP.
Figure 7. Pearson’s correlation (r) between mean seasonal cycle (MSC) 3D-CMCC-FEM GPP and the RS-based GPP: a) 3D-CMCC-FEM GPP vs. GOSIF GPP for the period 2005–2019, b) 3D-CMCC-FEM GPP vs. CFIX GPP for the period 2005–2013, c) 3D-CMCC-FEM GPP vs. FLUXCOM GPP for the period 2005–2015, d) histogram of the r, dashed lines indicate the median value. White areas on the maps indicate areas not simulated by the 3D-CMCC-FEM.
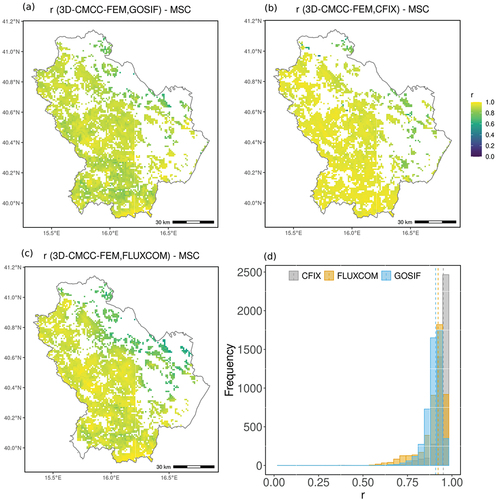
Figure 8. Spatial distribution of the slope of the linear regression of the summer GPP residuals and SPEI5 for: a) 3D-CMCC-FEM vs. GOSIF, b) 3D-CMCC-FEM vs. CFIX, c) 3D-CMCC-FEM vs. FLUXCOM. Grey areas indicate the slope is not significantly different from 0 at p < 0.05. White areas on the maps indicate areas not simulated by the 3D-CMCC-FEM.
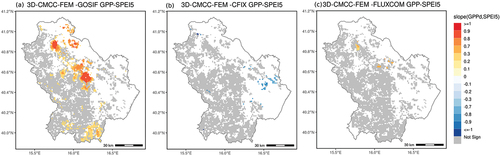
Figure 9. Mean annual 3D-CMCC-FEM GPP vs. RS-based GPP scatter plot (gC m−2 yr−1) at the species-level: a) the 3D-CMCC-FEM GPP vs. GOSIF b) 3D-CMCC-FEM GPP vs. CFIX and c) 3D-CMCC-FEM GPP vs. FLUXCOM estimates (black line is the 1:1 line, dashed line is the linear fit). Each point represents data at grid cell level, different colors indicate the different species considered.
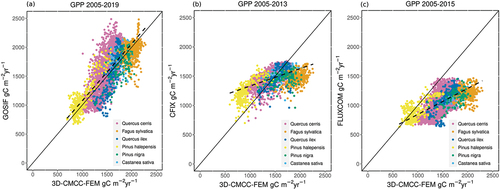
Table 3. Comparison of the 3D-CMCC-FEM GPP vs. RS-based GPP at single species level. RMSE= root mean square error (gC m−2 yr−1), RD = relative differences (%), r = Pearson’s correlation. Metrics are first computed at grid cell level and reported as the median value. In bold values with the best agreement between 3D-CMCC-FEM GPP and RS-based GPP.
Supplemental Material
Download MS Word (377.6 KB)Data availability statement
The 3D-CMCC-FEM model code version 5.6 is publicly available under the GNU General Public Licence v3.0 (GPL) and can be found on the GitHub platform at: https://github.com/Forest-Modelling-Lab/3D-CMCC-FEM). All data and model executable, and scripts to perform analyses and figures presented in this work are provided open access in the Zenodo server (https://doi.org/10.5281/zenodo.8060401). Correspondence and requests for additional materials should be addressed to the corresponding author.