
Figures & data
Figure 1. Locations of the ground data used in this study. Colors represent the number of plots per location, and the box summarizes the plot categories regarding historic land use. The Pinus halepensis Mill. coverage has been extracted from the IV National Forest Inventory Map National Forest Map 1:25,000 (2007–2017) (MAGRAMA 2012).
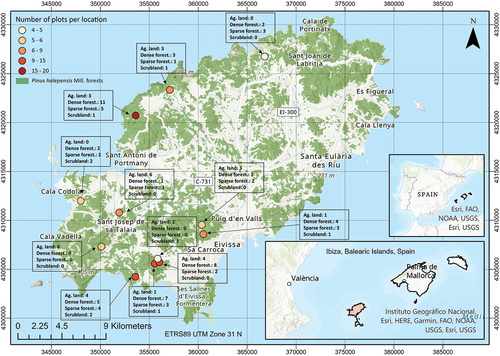
Table 1. Forest inventory summary of the measured and modeled variables, classified by historic land use and past cover.
Table 2. Pinus halepensis Mill. allometric and volumetric equations.
Table 3. Names of the variables computed for the ABA methodology.
Table 4. Names of the variables computed for the ITD methodology.
Figure 2. General overview of the methodologies applied in this study. In blue, are the method steps that involve ground data, in green are the steps that involve LiDAR data and in orange are the steps that involve both.
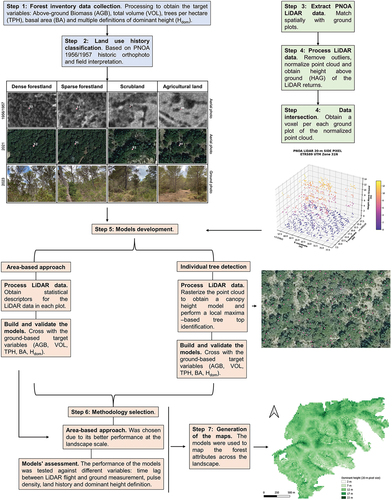
Table 5. Expressions to predict forest attributes for both LiDAR-based methodologies.
Figure 3. Maps of basal area (1), dominant height (2), volume (3) and above-ground biomass (4) for a forested area of the southwestern part of Ibiza Island. The maps have been generated using the models shown in (ABA) and the resolution is 20 m.
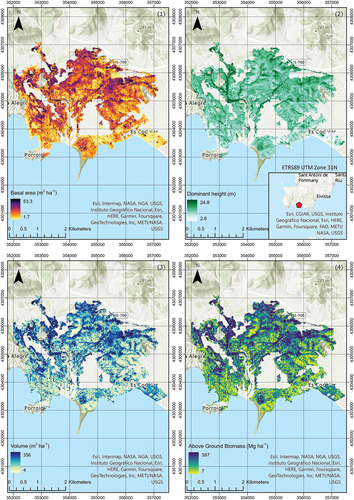
Table 6. Goodness of fit in terms of R2, RMSE, and RRMSE for all the models shown in for both LiDAR-based methodologies.
Figure 4. Performance of the models of above-ground biomass (1), total volume (2), trees per hectare (3), basal area (4), and dominant height (5) regarding time lag (left, in blue), and pulse density (right, in green). Residuals are calculated as the observed value minus the predicted value. The whiskers represent the 5th and 95th percentiles of the distribution. The white numbers correspond to the median values, and the black numbers above each box correspond to the number of observations in each group. The tree density model has been calculated for N = 106 plots, when measured TPH ≥ 750; the dominant height represents the average height of the 100 thickest trees per hectare (domHtassb). The fitted resolution is 20 m.
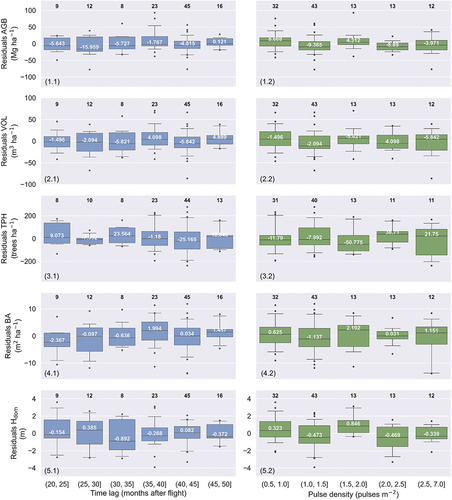
Figure 5. Behavior of the most explanatory covariate of above-ground biomass (AGB, 1) and volume (VOL, 2) (avgHtagrn1) by land cover historic use. Regression is fitted using a linear model to prevent overfitting due to limited sample size of each level. The fitted resolution is 20 m.
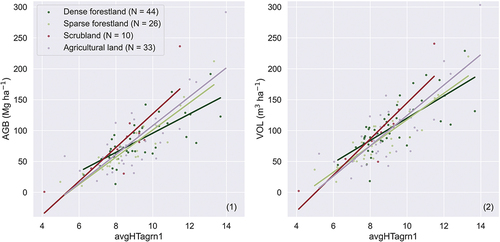
Figure 6. Behavior of the most explanatory percentile of height (pct95HTagrn1) for the five different dominant height definitions tested, and by land cover historic use. R2, RMSE, and RRMSE correspond to all data. The fitted resolution is 20 m.
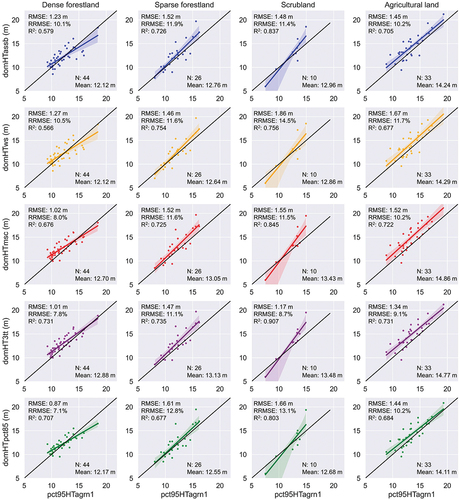
Table 7. Tukey’s HSD test results (alpha 0.05) for the analysis of past use and land history effect on site index in meters for a base age of 80 years.
Data availability statement
The PNOA LiDAR and orthophotography data is openly available at https://centrodedescargas.cnig.es/CentroDescargas/index.jsp. Forest inventory data is property of the landowners and managed by TERRAPI WORLD S.L. and will be available from the corresponding author (VARC) upon reasonable request.