Figures & data
Figure 1: Timeline demonstrating day of isolation of VRE in relation to period of admission in the seven patients admitted to HU.
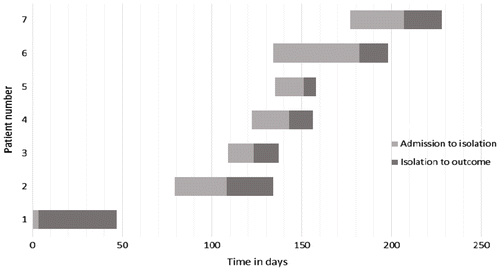
Table 1: Clinical and demographic data of 9 patients with VRE at IALCH
Table 2: Clinical and demographic data of 4 patients with VRE at private hosptials in KZN IALCH
Table 3: Antimicrobial exposure and outcome in 13 patients with VRE
Table 4: Results of PFGE of five environmental samples from HU
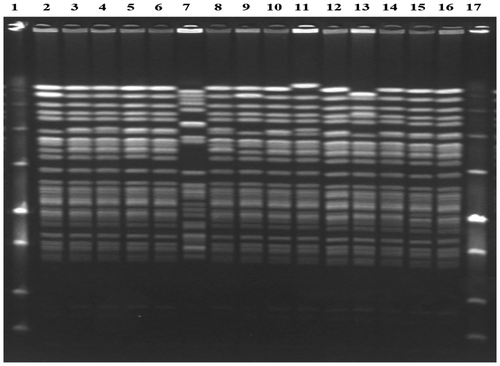
Figure 2: PFGE results of all VRE isolates tested.
Lane 2, commode; Lane 3, door of patient 4; lane 4, Patient 6 (blood culture); Lane 5, Patient 6 (CVP tip); Lane 6, table; Lane 7, Patient 4 (blood culture 6 September 2011); Lane 8, Patient 2; Lane 9, Patient 4 (blood culture- 9 September 2011); Lane 10, commode; Lane 11 dripstand; Lane 12, Patient 8, Lane 13, Patient 1; Lane 14, Patient 10; Lane 15, Patient 11; Lane 16, patient 12; Lanes 1 and 17 are molecular size markers