Figures & data
Figure 1. PSAI among PVL positive and negative isolates: this scatterplot is showing a higher PSAI among PVL positive isolates (p<0.001).
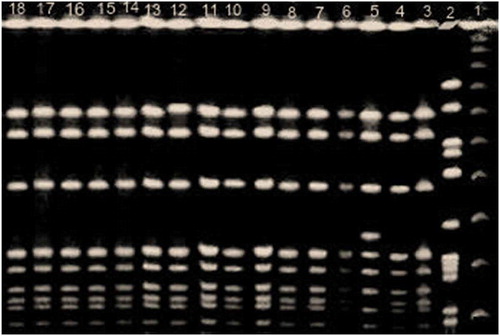
Figure 2. SmaI restriction endonuclease patterns obtained by PFGE: Lane 1, marker; lanes 3,4,7,8,9,10,11,12,13,14,15,16,17,18 MRSA strains showed the same pulsotype; lanes 2, 5, and 6showed three different pulsotypes.