Figures & data
Figure 1. Schematic representation of synthesis of Schiff base ligand
Figure 2. MS spectrum of L
Figure 3. 1H-NMR spectrum of L
Figure 4. 13C-NMR spectrum of L
Figure 5. FT IR spectrum of L
Table 1. FTIR spectral data of the Schiff base ligand [L] and its metal complexes
Figure 6. IR spectra of L and its metal complexes
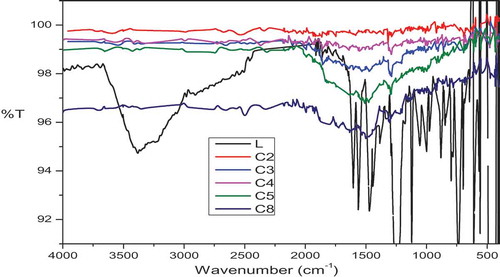
Figure 7. The electronic spectra of ligand L and its metal complexes in DMSO
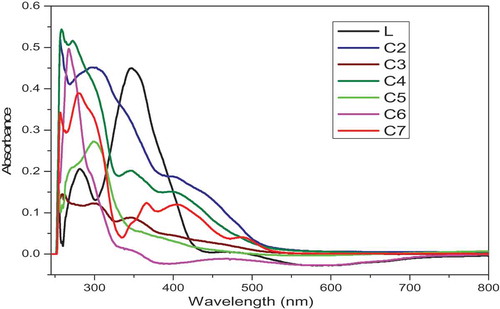
Figure 8. Thermograms of Cu(II), Co(III), Ni(II) and VO(IV) complexes
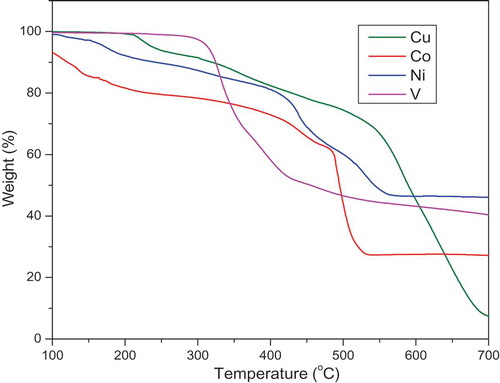
Table 2. EPR spectral parameters for copper and oxidovanadium complexes in DMSO at 77 K
Figure 9. ESR spectrum of C1, C2, C7 and C8
Figure 10. Proposed structures of the prepared metal complexes
Table 3. Antimicrobial results of the Schiff base ligand and its metal complexes
Table 4. MIC [μg/ml] values for antimicrobial activity of Schiff base ligand and its corresponding metal complexes
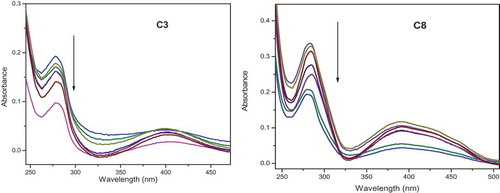
Figure 11. Electronic absorption spectra of complexes C3 and C8 (50 μM) in Tris/NaCl buffer (pH = 7.2) upon addition of CT-DNA (0–25 μM). Arrow shows the absorbance changing upon increase of DNA concentration. Inset: linear fit of [DNA]/(ɛa-ɛf) v/s [DNA] for the titration of the C3 and C8 complexes with CT-DNA
![Figure 11. Electronic absorption spectra of complexes C3 and C8 (50 μM) in Tris/NaCl buffer (pH = 7.2) upon addition of CT-DNA (0–25 μM). Arrow shows the absorbance changing upon increase of DNA concentration. Inset: linear fit of [DNA]/(ɛa-ɛf) v/s [DNA] for the titration of the C3 and C8 complexes with CT-DNA](/cms/asset/460e7781-3182-4e9f-b5b3-7c7f2cc890fe/teba_a_1758890_f0011_oc.jpg)
Figure 12. Emission spectra of EB bound to DNA in the presence of the complexes C3 and C8; λex = 450 nm, at the concentration 0–30 μM in Tris–HCl/NaCl buffer (pH 7.2). [EB] = 10 µM, [CT-DNA] = 100 µM. The arrow shows the intensity changes upon increasing concentrations of the complex. Inset: linear fit IO/I v/s [complex], Stern-Volmer quenching curves for the fluorescence titration of complexes C3 and C8 to DNA-EB bound system
![Figure 12. Emission spectra of EB bound to DNA in the presence of the complexes C3 and C8; λex = 450 nm, at the concentration 0–30 μM in Tris–HCl/NaCl buffer (pH 7.2). [EB] = 10 µM, [CT-DNA] = 100 µM. The arrow shows the intensity changes upon increasing concentrations of the complex. Inset: linear fit IO/I v/s [complex], Stern-Volmer quenching curves for the fluorescence titration of complexes C3 and C8 to DNA-EB bound system](/cms/asset/e1496495-09fa-41ae-8848-3f26c7339112/teba_a_1758890_f0012_oc.jpg)
Figure 13. Effect of increasing the concentration of the complexes on the relative viscosities of CT‐DNA at 27.0 ± 0.1°C in 5 mM tris‐HCl buffer (pH = 7.2)
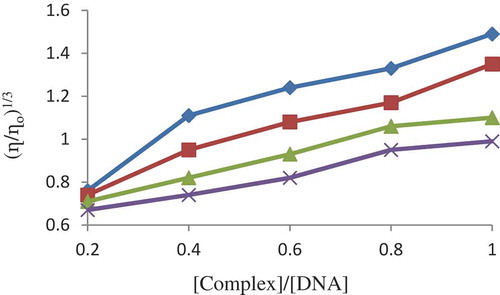
Figure 14. Emission spectra of BSA (λex = 280 nm; λem = 341 nm for C3, 342 nm for C8) as a function of concentration of the complexes. Arrow indicates the effect of metal complexes C3 and C8 on the fluorescence emission of BSA. Insert: shows the Stern-Volmer plot
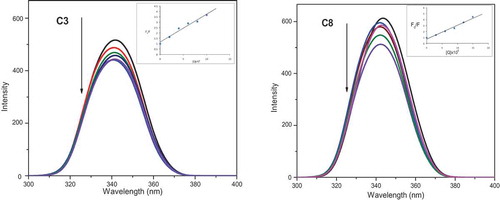
Figure 15. Absorption spectrum of BSA in the presence of complexes C3 and C8 having concentration range (0–35 µM) at room temperature. An arrow shows the absorbance changes upon increasing BSA concentration