Figures & data
Table 1. Experimental groups
Table 2. Body weight changes of infected and non-infected pregnant mice treated with the plant extracts compared with the control at gestation days (GD) 1, 9, and 17
Table 3. Daily chemosupression in treated and control groups of pregnant-infected mice
Figure 1.: Effect of M. lucida and C. citratus extracts on placenta parasitemia
Figure 2. Section of (a) Oviduct of mice treated with E. chlorantha extract: showing well-formed glands (long arrows) in the endometrial submucosa. The epithelia lining is normal (short arrows), H and E × 400 (b) Uterus of mice treated with E. chlorantha extract showing fetal resorption (long arrows) Mag ×1.5
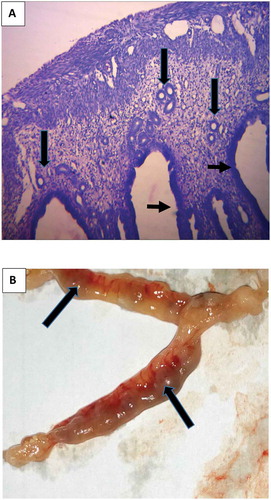
Figure 3. (a-d): Photomicrograph of cross histological section of the placenta from mice showing; A (infected not treated), B (not infected not treated) C (infected treated with fansidar) D (not infected treated with fansidar) (a) Trophoblastic cells that appear pyknotic (long arrow) in the infected mouse, degeneration and coagulative necrosis (small arrow) of the labyrinth, parasitized red blood cells and malaria parasite pigments). (b-d) No visible lesions in both infected (treated) and non-infected groups. H and E × 400
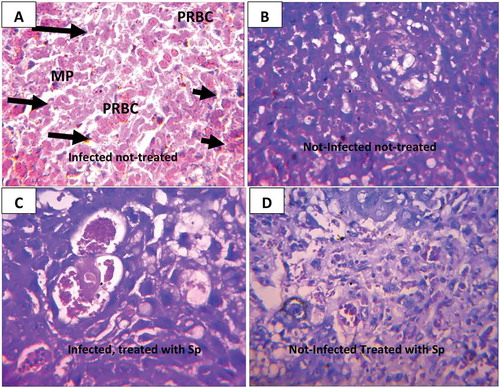
Figure 4. Photomicrograph of cross histological section of the placenta from mice treated with different concentrations of C. citratus; (a-c) Infected mice treated with 100, 200 and 300 mg/kg body weight respectively. (d-f) Non-infected mice treated with 100, 200 and 300 mg/kg body weight, respectively. (a-c) few trophoblastic cells that appear pyknotic in the infected-treated group (Long arrow). (d-f) No visible lesions in non-infected groups. Parasitized red blood cells (PRBC). H and E × 400
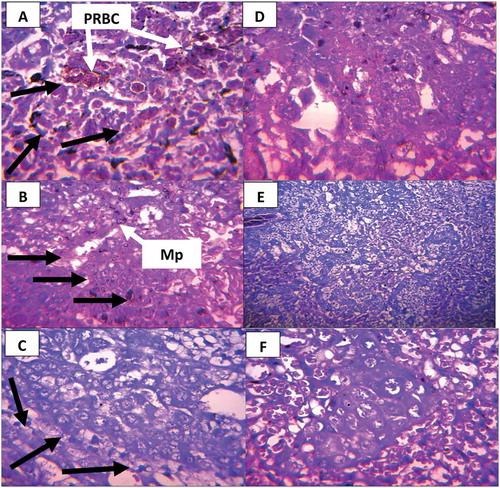
Figure 5. (a-f): Photomicrograph of cross histological section of the placenta from mice treated with different concentrations of M. lucida; (a-c) Infected mice treated with 100, 200 and 300 mg/kg body weight respectively. (d-f) Non-infected mice treated with 100, 200, and 300 mg/kg body weight, respectively. (a) Few trophoblastic cells that appear pyknotic in the infected-treated group (Long arrow). (b-f) No visible lesions in both infected and non-infected group, H and E × 400
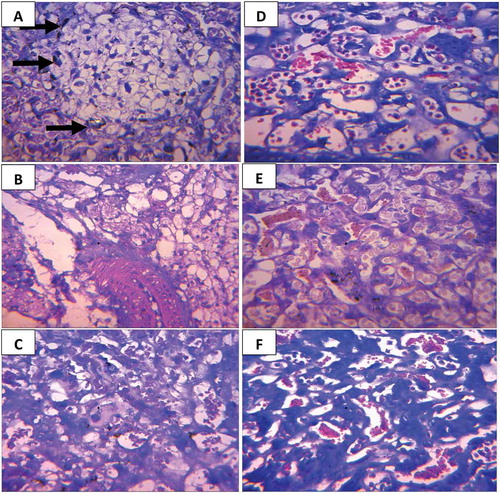
Table 4. Effect of plant extracts on pregnancy outcome of infected and non-infected pregnant mice
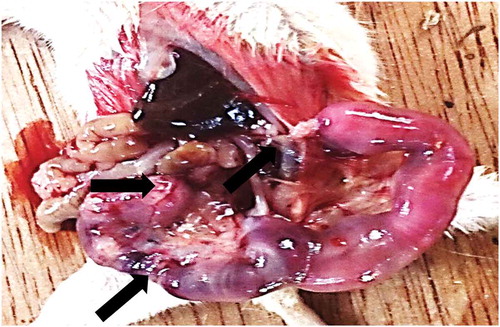
Figure 6. Uterus of mice showing Miscarriage and Necrosis of the mice’s uterus