Figures & data
Table 1. Effects of ethanolic extract of Garuga pinnata on blood biochemical parameters by Paracetamol induced hepatotoxicity (SGOT, SGPT, ACP, ALP and creatinine)
Table 2. Effects of ethanolic extract of Garuga pinnata on blood biochemical parameters by Thioacetamide induced hepatotoxicity (SGOT, SGPT, ACP, ALP and creatinine)
Table 3. Effects of ethanolic extract of Garuga pinnata on blood biochemical parameters by Ethanol induced hepatotoxicity (SGOT, SGPT, ACP, ALP and creatinine)
Table 4. Effects of ethanol extract of Garuga pinnata on tissue biochemical estimations by Paracetamol induced hepatotoxicity (SOD, CAT, GSH, LPO and Total proteins)
Table 5. Effects of ethanol extract of Garuga pinnata on tissue biochemical estimations by Thioacetamide induced hepatotoxicity (SOD, CAT, GSH, LPO and total proteins)
Table 6. Effects of ethanol extract of Garuga pinnata on tissue biochemical estimations by Ethanol induced hepatotoxicity (SOD, CAT, GSH, LPO and total proteins)
Figure 1. Histopathology of PCM induced hepatotoxicity model; (1A) Normal control group- Showing well defined liver architecture with normal hepatic cells without any damage, (1B) PCM Treated group- showed the degenerative hepatocytes with necrosis causing severe degree of liver damage, (1 C) Standard silymarin (100 mg/kg) treatment group- showed the mild degree of liver damage and restoring hepatocytes, (1D and 1E) Group treated with Garuga pinnata (200 mg/kg and 400 mg/kg) showed the regeneration of liver cells with mild degree of liver damage
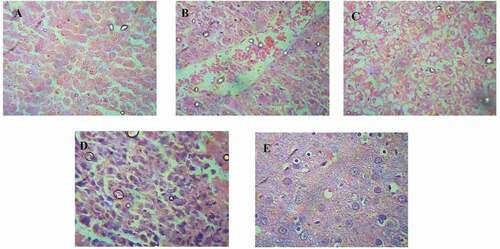
Figure 2. Histopathology of TAA induced hepatotoxicity model; (2A) Normal control group- Showing well defined liver architecture with normal hepatic cells with conserved cytoplasm, (2B) TAA Treated group- showed the degenerative hepatocytes with necrosis causing severe degree of liver damage, (2 C) Standard silymarin (100 mg/kg) treatment group- showed the mild degree of liver damage and restoring hepatocytes, (2D and 2E) group treated with Garuga pinnata (200 mg/kg and 400 mg/kg) showed the regeneration of liver cells with mild degree of liver damage
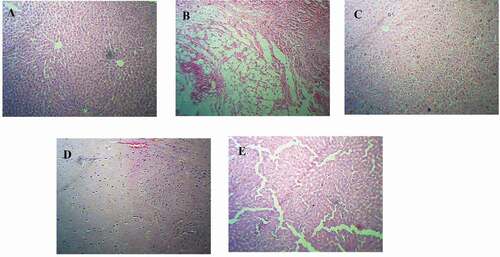
Figure 3. Histopathology of Ethanol induced hepatotoxicity model; (3A) Normal control group- showing well defined liver architecture with normal hepatic cells with conserved cytoplasm, (3B) ethanol treated group- showed the degenerative hepatocytes with necrosis causing severe degree of liver damage, (3 C) standard silymarin (100 mg/kg) treatment group- showed the mild degree of liver damage and restoring hepatocytes, (3D and 3E) group treated with Garuga pinnata (200 mg/kg and 400 mg/kg) showed the regeneration of liver cells with mild degree of liver damage
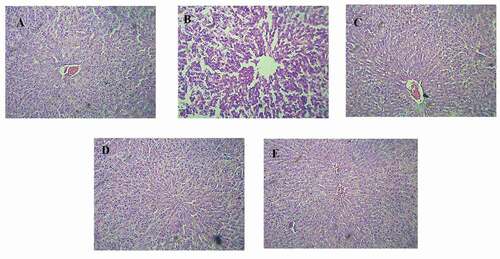
Figure 4. Characteristic UV peak of isolated compound at 251 nm indicating the compound belonging to flavonoids group
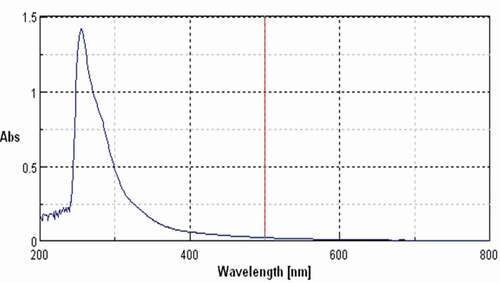
Figure 5. FTIR spectra of isolated compound showing characteristic peak of flavonoids
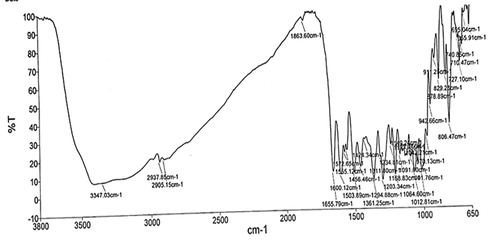
Table 7. Functional group characterization using δ ppm of ethyl acetate fraction of Garuga pinnata.
Figure 6. NMR spectra of isolated compound obtained from ethyl acetate fraction of Garuga pinnata.
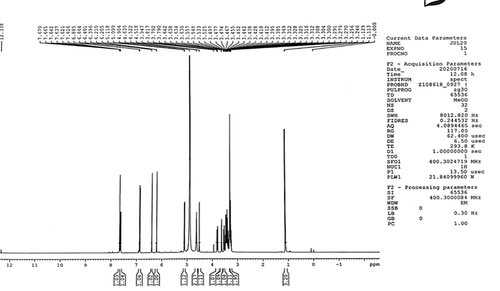
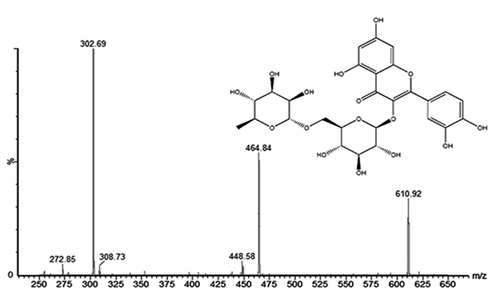
Figure 7. GC-MS spectra of isolated compound obtained from Garuga pinnata.