Figures & data
Table 1. Effect of coragen on mother’s body weight gain (BWG), uterus weight, resorption per dam and placental weight in the control and different treated groups
Figure 1. Photographs of the uteri of pregnant albino rats secluded at 20th day of gestation. (A) Control group showing uterus with normal distribution of fetuses in both horns. (B, C) LD group, (D, E) HD group. Uterine bleeding (arrow), dead fetuses (lines), resorbed fetus (head arrow). F = fetus, Pl = placenta, V = vagina
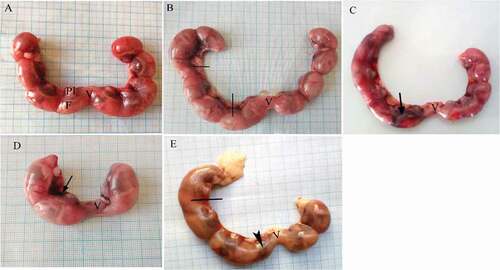
Table 2. Effect of coragen on fetal weight and length, number of hematoma and dead fetuses of mothers in the control and different treated groups
Figure 2. Photographs of fetuses at 20th day of gestation. (A) Control group showing fetus with normal morphology. (B, C) LD group: fetuses suffer from hematoma at different regions of body as head and back (arrow). (D) HD group showing hematoma (arrow). Pl = Placenta
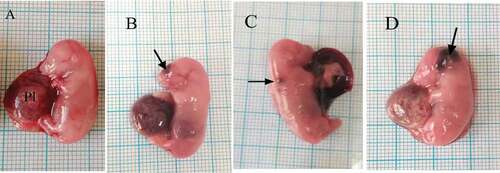
Table 3. Effect of coragen on skeletal examination of fetuses in the control and different treated groups (N = 32)
Figure 3. Photographs of the cranial skeleton of fetuses at 20th day of gestation (Alcian blue–Alizarin red double stain). (A) Control group with normal ossification of the cranial bones. (B) LD group: incompletely ossified cranial bones. (C) HD group: unossified cranial bones. N = nasal, Mx = maxilla, Mn = mandible, Fr = frontal, and Pr = parietal
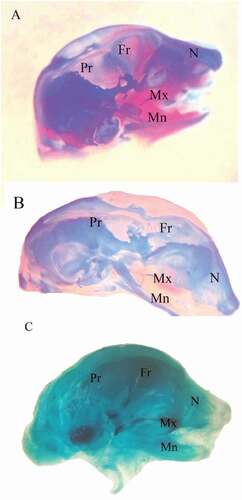
Figure 4. Photographs of the vertebral column and ribs of fetuses at 20th day of gestation (Alcian blue–Alizarin red double stain). (A) Control group: vertebral column showed complete ossification of all vertebrae and normal appearance of ribs. (B, C) LD group: vertebral column showed shortage of the last rib (arrow), and unossified vertebrae (head arrow) and loss of chondrification of some tail vertebrae (wavy arrow). (D) HD group: unossification of vertebral column and centra. (head arrow). ThV = thoracic vertebra and LV = lumbar vertebra
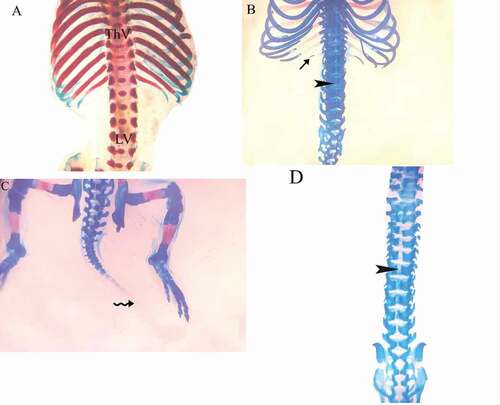
Figure 5. Photographs of the sternum of fetuses at 20th day of gestation (Alcian blue–Alizarin red double stain). (A) Control group: ossification of all sternebrae. (B) LD group: incomplete ossification of the sternum. (C) HD group: unossified sternebrae
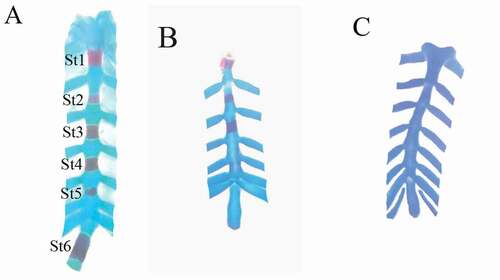
Figure 6. Photographs of the pectoral girdle and forelimb of fetuses at 20th day of gestation (Alcian blue–Alizarin red double stain). (A) Control group: pectoral girdle and forelimbs showed complete ossification of all bones. (B) LD group. (C) HD group: showed incomplete ossification of all bones. Sc = scapula, C = clavicle, Hu = humerus, R = radius, U = ulna, Mc = metacarpals, and Ph = phalanges
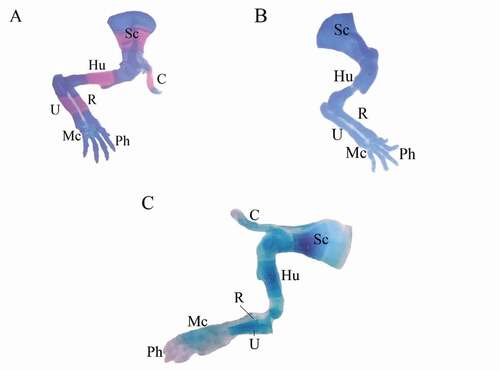
Figure 7. Photographs of the pelvic girdle and hind limbs of fetuses at 20th day of gestation (Alcian blue–Alizarin red double stain). (A) Control group: showed ossification of bones of pelvic girdle and hind limbs. (B, C) LD group: showed unossification of the metacarpals (arrow) or unossification of all hind limb bones (tibia, fbula, metatarsals, and phalanges). (D) HD group: completely unossified bones. I = ilium, Is = ischium, Ps = pubis, Fe = femur, Fi = fbula, Ti = tibia, Mt = metatarsals, and Ph = phalanges
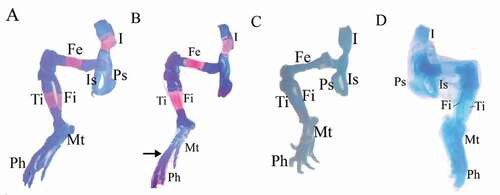
Figure 8. Photomicrographs of liver sections of pregnant dams (stained with H&E) obtained on the 20th day of gestation. (A) Control group: normal lobular architecture with regular arrangement of hepatocytes around a central vein. Hepatocytes and their nuclei and blood sinusoids are normal in shape. (B) LD group, (C, D) HD group: loss of hepatocyte architecture, wide sinusoids (lines), lymphatic infiltration (arrow), cytoplasmic vacuoles (wavy arrow). hemorrhage (asterus), apoptotic cells (curved arrow). H = hepatocytes, CV = central vein, S = sinusoids, and K = Kupffer cells
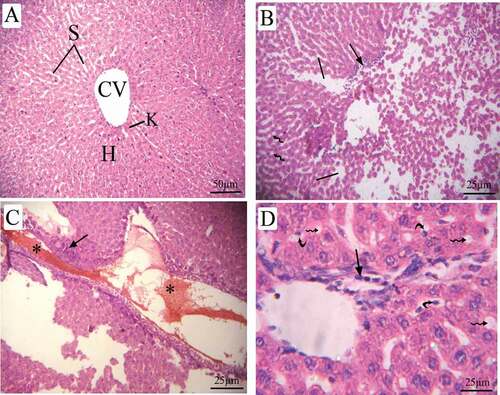
Figure 9. Photomicrographs of fetal liver sections (stained with H&E) at 20th day of gestation (A) Control group: normal structure of liver with normal hepatocyte nuclei. (B) LD group, (C) HD group: showed cytoplasmic vacuoles (arrow), vacuolated hepatocytes (head arrow), degenerated hepatocytes (asterus), Central vein with degenerated endothelial lining (lines), Megakaryocytes (M) and dilated sinusoid (wavy arrow)
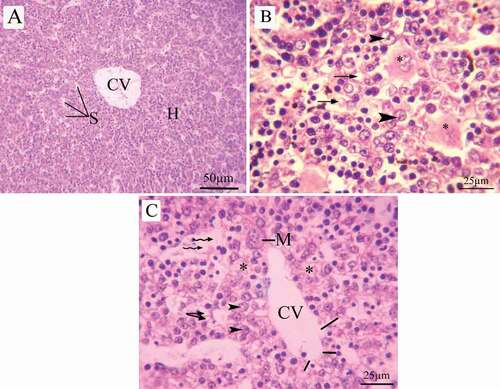
Figure 10. Photomicrographs of a transverse section of maternal kidney tissue (stained with H&E) at the 20th day of gestation. (A) Control group: normal histologic pattern of renal tissues; normal glomeruli surrounded by Bowman’s capsule and normal capsular space and normal renal tubules (RT). (B) LD group, (C,D) HD group: shredded nuclei into the tubule lumen (arrow), hypertrophy (line), and hyperplasia of the tubular epithelial lining (wavy arrow), disappearance of lumen (arrow head), inflammatory infiltration (curved arrow), fragmented tubular epithelial lining (U-shaped arrow), hemorrhage (asterus) and distortion in the epithelial lining of Bowman’s capsule (blue arrow). G = glomeruli, BC = Bowman’s capsule, CS = capsular space, and RT = renal tubules
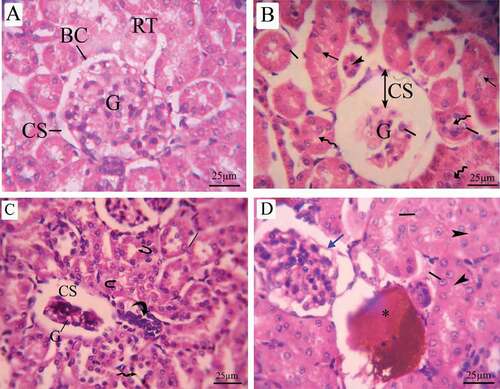
Figure 11. Photomicrographs of fetal kidney transverse sections (stained with H&E) at 20th day of gestation. (A) Control group: distinct Bowman’s capsule-enclosed normal glomeruli with normal urinary space. Renal tubules with normal nuclei were observed. (B) LD group, (C,D) HD group: damaged glomeruli surrounded by a decomposed Bowman’s capsule basement membrane (head arrow)and increase in the intercapsular space (line), disappearance of lumen of renal tubules (arrow), damaged tubules (wavy arrow), necrosis, Karyolysis, increase in the number of parenchymal cells and renal tubule hypertrophy (curved arrow). BC = Bowman’s capsule, G = glomeruli, RT = renal tubules, N = necrosis, K = karyolysis, and Pa = parenchymal cells
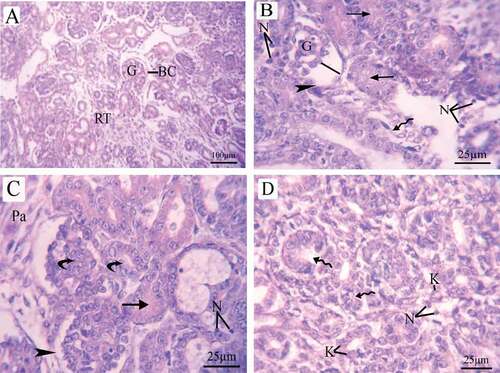
Figure 12. Effect of coragen on DNA damage induced in maternal liver and kidney tissues represented as (A) tail length, (B) % DNA in tail and (C) tail moment in different treated groups. *Significant difference as compared to the control group (P < 0.05), #Significant difference as compared to LD group (P < 0.05)
Figure 13. Effect of coragen on DNA damage induced in fetal liver and kidney tissues represented as (A) tail length, (B) % DNA in tail and (C) tail moment in different treated groups. *Significant difference as compared to the control group (P < 0.05), #Significant difference as compared to LD group (P < 0.05)
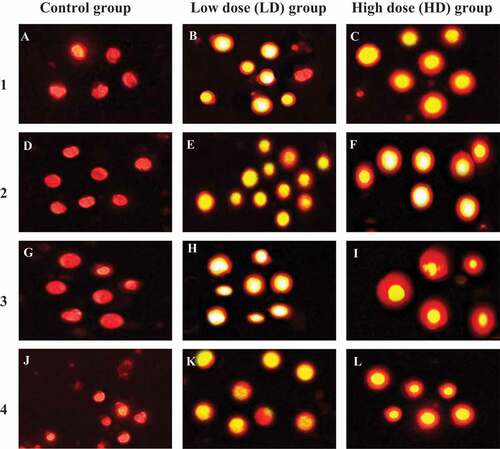
Figure 14. Representative photomicrographs showing typical nuclei with various degrees of DNA damage observed as comet induced by coragen in maternal and fetal liver and kidney tissues. LD group and HD group were compared with undamaged DNA of control group. 1, maternal liver cells; 2, fetal liver cells; 3, maternal kidney cells and 4, fetal kidney cells. Magnification x400