Figures & data
Table 1. Body weight gain and relative organ weights of Control, IND alone, IND + THY and THY alone rats for 21 days
Table 2. Hepatic function biomarkers in rats treated with IND alone, IND with THY and THY alone for 21 days
Table 3. Renal function biomarkers in rats treated with IND alone, IND with THY and THY alone for 21 days
Table 4. Serum lipid profile of rats treated with IND alone, IND with THY and THY alone for 21 days
Table 5. Hepatic and renal antioxidant status in rats treated with IND alone, IND with THY and THY alone for 21 days
Figure 1. Effect of thymol on hepatic and renal TAC and TOS levels in indomethacin-treated rats. n = 8. Each bar represents mean ± SEM of 8 rats. ap < 0.05 versus control; bp < 0.05 versus IND alone. IND: 5 mg/kg indomethacin; THY: 250 mg/kg thymol.
Figure 2. Influence of thymol on hepatic and renal MPO activity and NO level in indomethacin-treated rats. n = 8.Each bar represents mean ± SEM of 8 rats. ap < 0.05 versus control; bp < 0.05 versus IND alone; cp < 0.05 versus THY alone. IND: 5 mg/kg indomethacin; THY: 250 mg/kg thymol.
Figure 3. Effect of thymol on hepatic and renal levels of TNF-α, IL-1β and caspase-3 activity in indomethacin-treated rats. n = 8. Each bar represents mean ± SEM of 8 rats in triplicates. ap < 0.05 versus control; bp < 0.05 versus IND alone; cp < 0.05 versus THY alone. IND: 5 mg/kg indomethacin; THY: 250 mg/kg thymol.
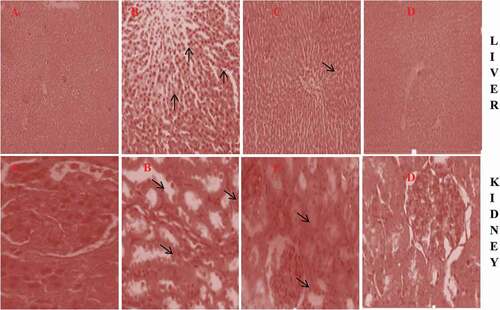
Figure 4. Photomicrograph of representatives liver and kidney of (A) Control, (B) IND alone, (C) IND + THY and (D) THY alone. Control liver and kidney showed intact architectural arrangement. Liver of IND alone rats showed infiltration of inflammatory cells, dispution of hepatocytes arrangement and enlargement of the sinusoids; Liver of rat co-treated with IND + THY showing few inflammatory cells while THY alone treated group showing near to normal architecture. The kidney of IND alone showed vacuolation and renal tubular necrosis, disintegration of medullary tubules with edema (arrow) at interstitium and inflammatory cellular infiltration. The kidney of rats co-treated with IND + THY showed mild tubular degeneration and infiltration of inflammatory cells whereas THY alone treated group showing near to normal architecture (H & E X 400).