
Figures & data
Figure 1. 3D structure of the 3ERT receptor.
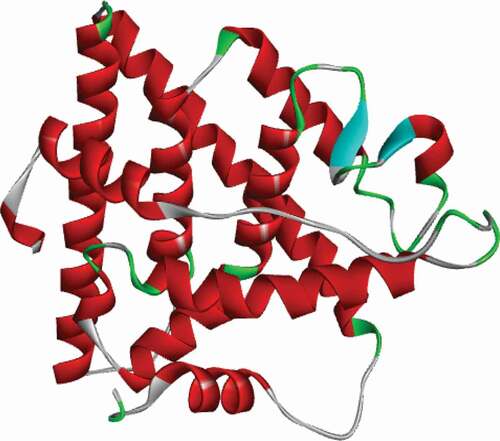
Figure 2. 3D structure of compound 1.
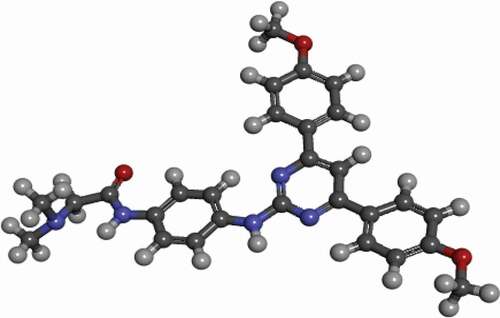
Figure 3. 3D and 2D representations of Compound 3 in the active site of the 3ERT receptor.
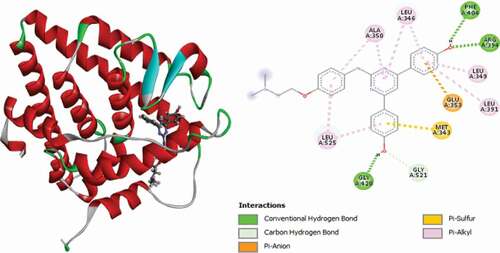
Table 1. Docking scores of the analyzed compounds against the 3ERT receptor with Tamoxifen as the reference
Table 2. Various interactions between the potential hit compounds and the active site of the 3ERT receptor
Figure 4. 3D and 2D representations of Compound 5 in the active site of the 3ERT receptor.
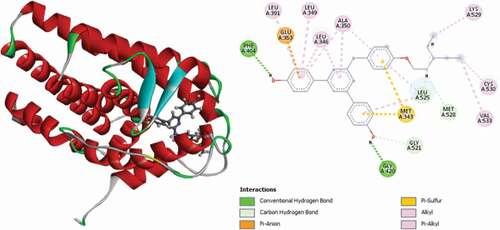
Figure 5. 3D and 2D representations of Compound 7 in the active site of the 3ERT receptor.
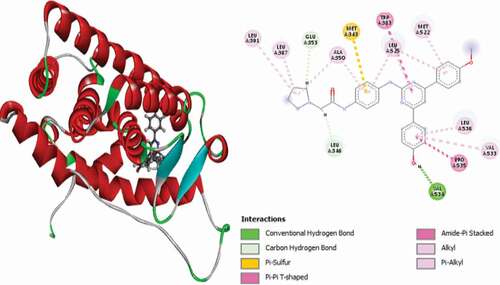
Figure 6. 3D and 2D representations of Compound 8 in the active site of the 3ERT receptor.
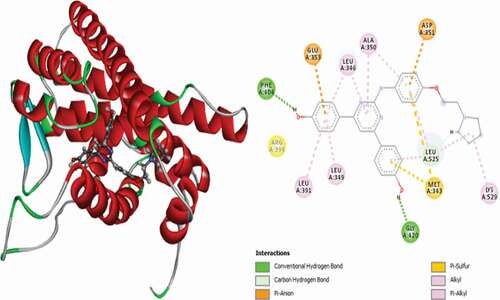
Figure 7. 3D and 2D representations of Compound 9 in the active site of the 3ERT receptor.
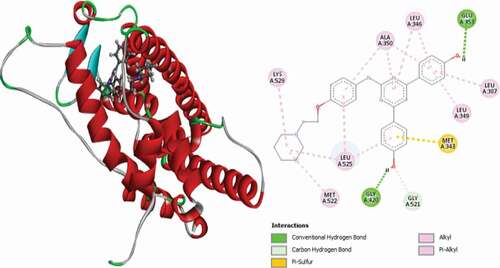
Figure 8. 3D and 2D representations of Compound 12 in the active site of the 3ERT receptor.
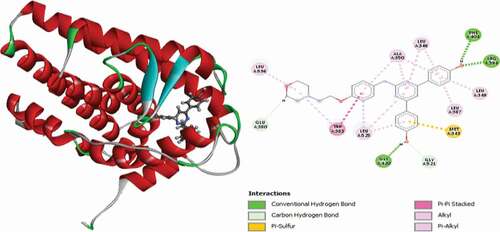
Figure 9. 3D and 2D representations of Compound 15 in the active site of the 3ERT receptor.
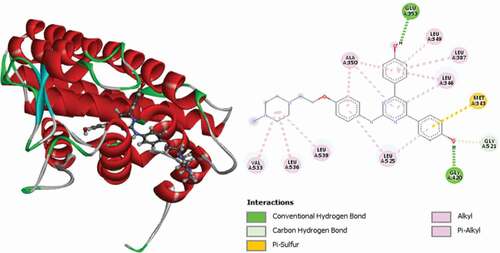
Figure 10. 3D and 2D representations of Compound 18 in the active site of the 3ERT receptor.
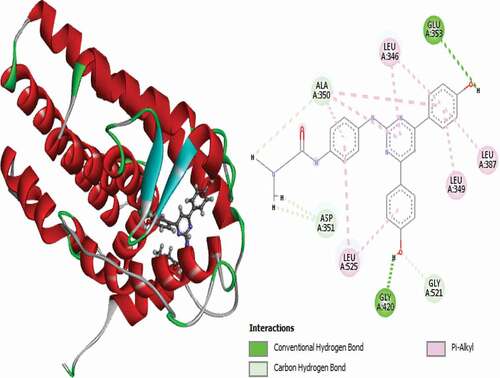
Figure 11. 3D and 2D representations of Compound 21 in the active site of the 3ERT receptor.
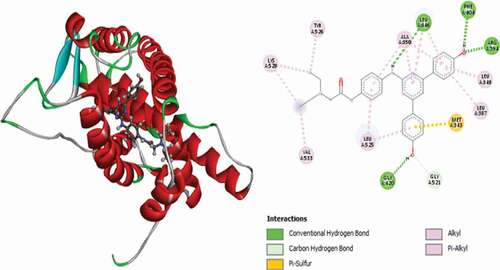
Figure 12. 3D and 2D representations of Compound 23 in the active site of the 3ERT receptor.
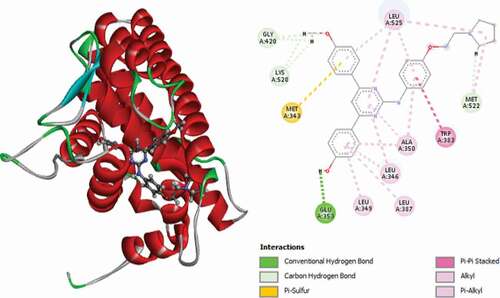
Figure 13. 3D and 2D representations of Compound 24 in the active site of the 3ERT receptor.
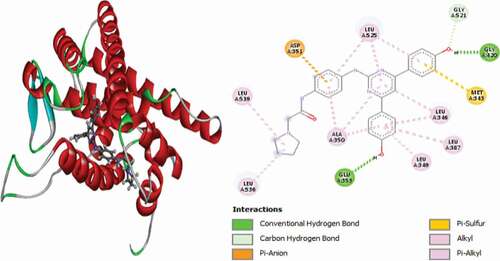
Figure 14. 3D and 2D representations of Compound 27 in the active site of the 3ERT receptor.
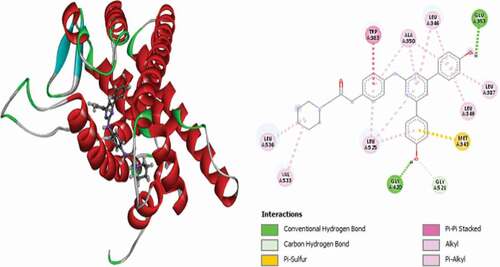
Figure 15. 3D and 2D representations of Compound 29 in the active site of the 3ERT receptor.
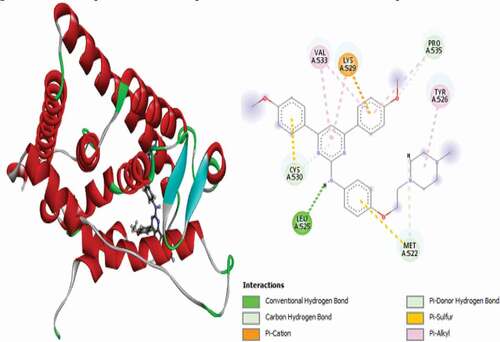
Figure 16. 3D and 2D representations of Compound 31 in the active site of the 3ERT receptor.

Figure 17. 3D and 2D representations of compound 50 in the binding site of the ER+ receptor.
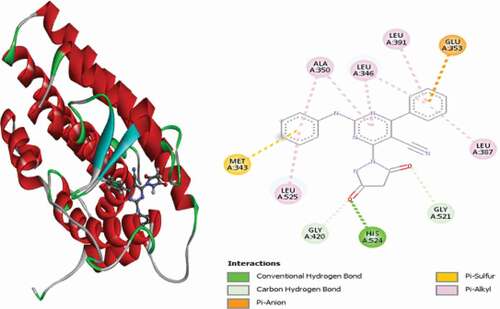
Figure 18. 3D and 2D representations of compound 51 in the active site of the ER+ receptor.
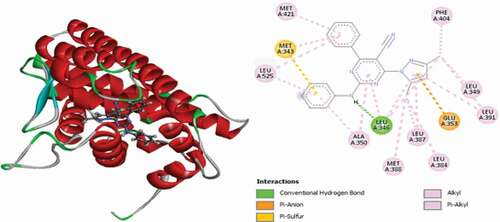
Figure 19. 3D and 2D interactions of compound 52 in the binding pocket of the ER+ receptor.
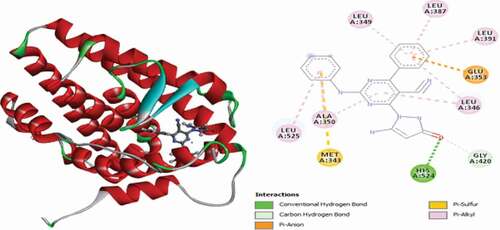
Figure 20. 3D and 2D representations of Compound 54 in the active pocket of the ER+ receptor.
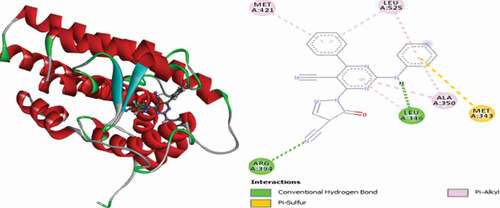
Figure 21. 3D and 2D interactions of compound 55 with the binding site of the ER+ receptor.
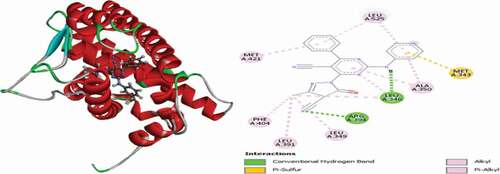
Figure 22. 3D and 2D representations of Tamoxifen in the active site of the 3ERT receptor.
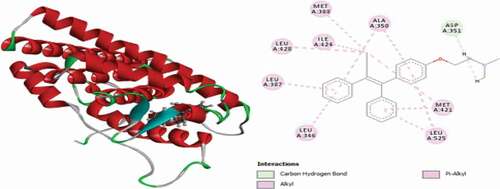
Figure 23. RMSD values of the protein and ligand during 1 ns MD simulation.
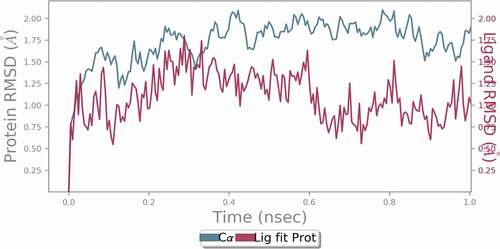
Figure 24. RMSF values of the backbone protein.
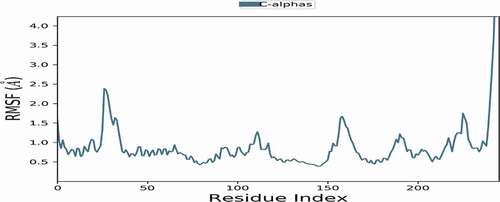
Figure 25. RMSF values of the ligand-protein complex.
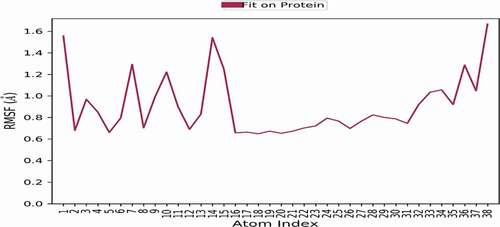
Figure 26. Radius of gyration of the ligand-protein complex during 1 ns dynamic simulation.
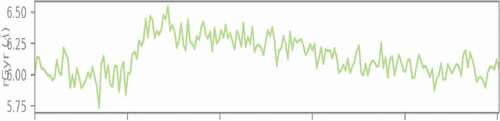
Figure 27. Ligand-protein contacts during 1 ns simulation studies.
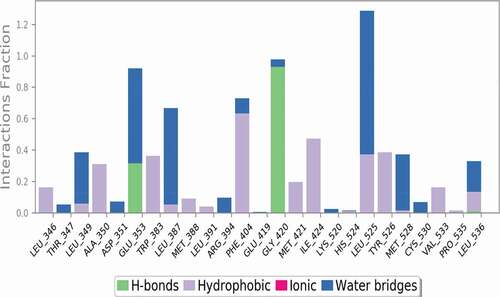
Table 3. Predicted drug-likeness properties of the selected compounds
Table 4. Predicted ADMET properties of the selected compounds