Figures & data
Figure 1. Open field neurobehavioral test. (A) Time of habituation (B) No of crossing (C) No of time freezing occurred. The PSD animals displayed obvious signs of poor memory and emotionality. In the open field test, the PSD group showed significantly reduced habituation time and horizontal locomotion (crossing), as well as increased freezing time when compared to the control and other treatment groups (p < 0.05). the values are expressed as mean ± SEM. P < 0.05 is considered to be statistically significant; * indicate significant level of difference in compared with control; + indicate significant level of difference in comparison with PSD group.
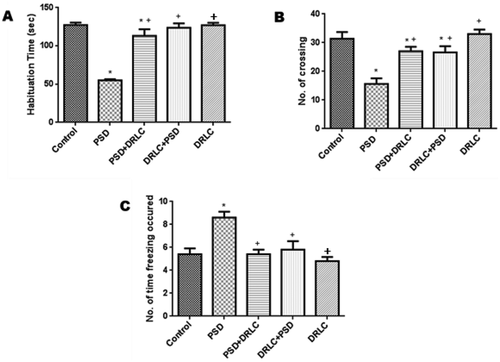
Figure 2. Elevated plus maze test. the PSD group exhibited low time of habituation and spent more time in the closed arm when compared with the control group (p < 0.05). animals pre and post-treated with DRLC in this study showed little or no emotional impairment as indicated by the significantly reduced time spent in the closed arm when compared with the PSD group (p < 0.05). the values are expressed as mean ± SEM. P < 0.05 is considered to be statistically significant; * indicate significant level of difference when compared with control; + indicate significant level of difference in comparison with PSD group.
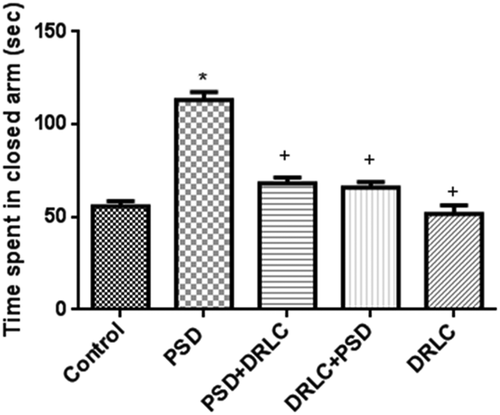
Figure 3. Oxidative stress markers. (A) Activities of superoxide dismutase, (B) Activities of catalase, (C) Concentration of glutathione, and (D) Concentration of malondialdehyde in the blood serum of rats. SOD and Catalase activities as well as glutathione concentration in PSD group was significantly reduced compared to DRLC rats. Malondialdehyde levels were significantly increased in PSD animals when compared with control and DRLC groups. the values are expressed as mean ± SEM. p < 0.05 is considered to be statistically significant; * indicate significant level of difference when compared with control; + indicate significant level of difference in comparison with PSD group.
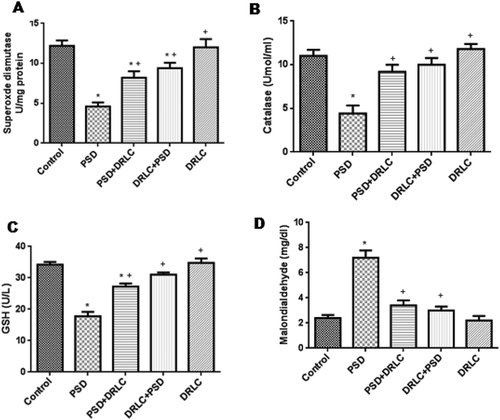
Figure 4. Representative photomicrographs showing the general morphology of the hippocampus of the Wistar rats across the various groups stained with H & E. (Scale bars: 50 µm). the Dentate Gyrus (DG) composed of granule cells, Cornu amonus (CA1-3) containing pyramidal cells, are well demonstrated across the experimental groups.
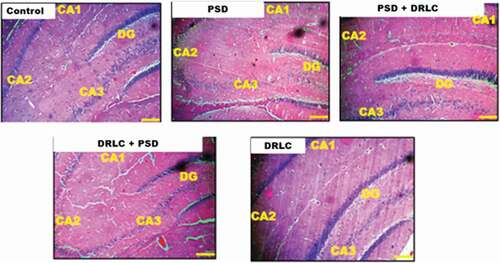
Figure 5. Representative photomicrographs showing the granule and pyramidal cells (neurons) of the hippocampus of the wistar rats across the experimental groups stained with H & E stain (scale bars: 25 µm) .
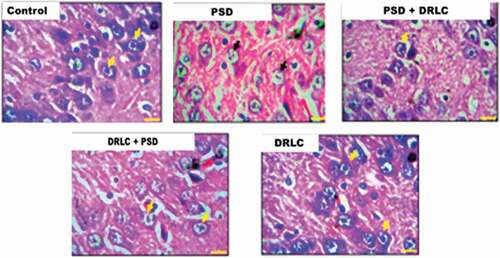
Figure 6. Representative photomicrograph showing the expression of nissl substance in the hippocampus of the wistar rats across the experimental groups stained with cresyl fast violet stain (scale bars: 50 µm) .
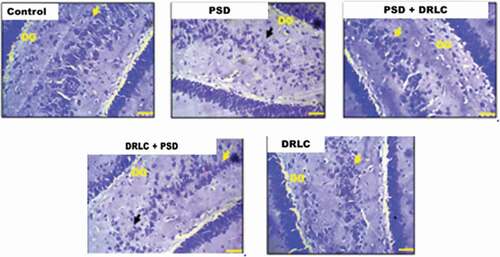
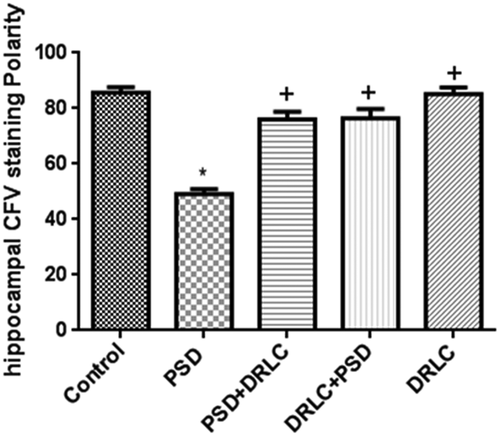
Figure 7. Cresyl fast violet staining intensity in the hippocampus. Reduced CFV staining was observed in the hippocampus of PSD groups when compared to DRLC treated groups. p < 0.05 is considered to be statistically significant; * indicate significant level of difference when compared with control; + indicate significant level of difference in comparison with PSD group.