Figures & data
Figure 1. (a) Photographs of the mice uteri on gestation days (GDs) 9.5, 10.5, 12.5, 13.5 and 18.5 in control and retinoic acid (RA) treated groups. Hematoma (white arrows), abnormal size of implantation sites (black arrows) and resorped fetuses (arrowheads). (b, c and d) Histograms represent the mean number of live fetuses, the mean of fetal lengths and fetal weights, respectively on GD 18.5 of control and RA treated groups. *P < 0.05, **P < 0.01 statistically different.
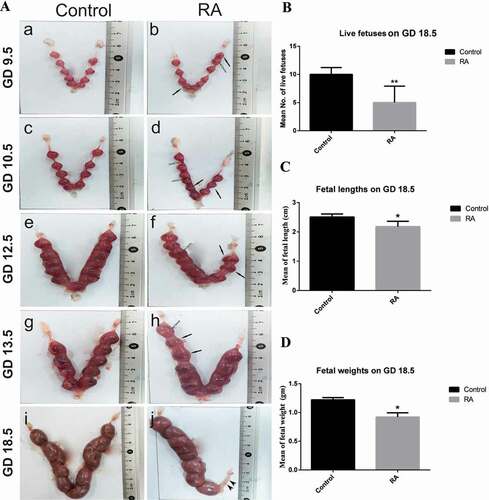
Figure 2. Photographs of mice fetuses on gestation day 18.5 showing external morphology. (a) normal fetus with correct shape and length from control group. (b), (c) and (d) the feuses from RA treated group showing some malformations as curved body, small head size, fore-and hind-limbs defects, opened eye, short tail and syndactyly.
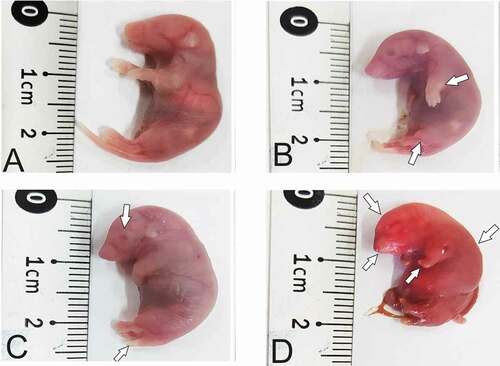
Figure 3. Photographs of the fetal skeletons of control and (RA) treated groups on gestation day 18.5. Normal ossification of the fetal skeleton from the control group (a,c,e,g and i). The fetal skeleton from (RA) treated group showing that incomplete ossification the skull (d and f), occipital condyles agenesis (f), caudal vertebrae agenesis (j), scapula and humerus hypoplasia (h), radius, ulna, carpus, meta carpus agenesis (h), femur hypoplasia (j), tibula, fibula, tarsus, meta tarsus agenesis (j), pelvic hypoplasia (b). Carpal (C), caudal vertebrae (Cv), fibula (E), femur (Fe), frontal (Fr), inter parietal (Ip), meta carpal (Mc), meta tarsus (Mt), occipital condyle (OC), parietal (p), pelvic element (Pe), radius (R), scapula (S), tarsus (T), tibia (Tb), ulna (U), vertebral centrum lumbar (Vcl), vertebral centrum sacral (Vcs), vertebral centrum thoracic (Vct). Alizarin staining. White arrows point to skeleton malformation (the analogous structure of control).
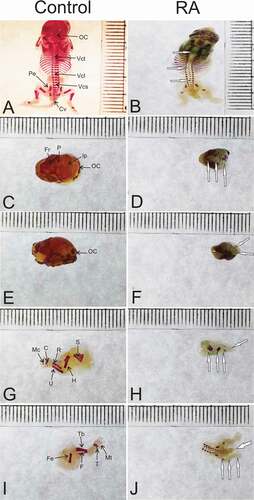
Figure 4. Photomicrographs of the transverse section of the mouse utero-placental unit on gestation day (GD) 9.5 from control (a, e, i, c, g, k) and RA treated (b, f, j, d, h, l) groups. (a, e, i) Histological structure of the utero-placental unit, maternal triangle (MT), decidual basalis (DB), junctional zone (JZ), labyrinth zone (LB). (e) a magnified part of the decidual basalis, (i) a magnified part of the junctional zone (JZ), labyrinth zone. (b, f, and j) Showing effect of RA treatment on the developing utero-placental unit, note that irregular shape with reduction of the thickness of both the junctional and labyrinth zones (Hx & E staining). (c, g, and k) illustrate the immunohistochemical localization of EGFR of the utero-placental unit from control group, note that EGFR is expressed at high level in the boundary and blood sinuses of decidual basalis and the junctional zone, and at low level in the labyrinth zone. (d, h, and l) showing the effect of RA on the expression level of EGFR. note that EGFR is expressed in the decidual basalis and the junctional zone at moderate level, while the labyrinth zone is devoid of immunoreaction. (m) Optical density of EGFR-positive areas in decidual basalis (DB), junctional zone (JZ) and labyrinth zone (LB). Density is expressed as the number of positive areas. **P < 0.01 compared with the control group. Allantois (All), Blood sinuses (BS), chorion (Ch) and trophoblast giant cell (TGC). Scale bar (a–d): 100 µm, (e–l): 50 µm.
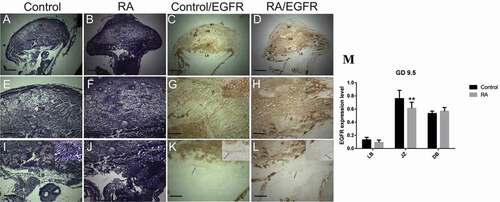
Figure 5. Photomicrographs of the transverse sections of the mice utero-placental units on gestation day (GD) 10.5 from control (a, e, i, c, g, k) and RA treated (b, f, j, d, h, l) groups. (a, e, i) Histology of the developed utero-placental unit from the control group showing, reduction of the thickness of decidual basalis (DB), and increase of the thickness of both junctional zone (JZ) and labyrinth zone (LB) comparing to the previous stage (GD9.5). (e) a magnified part of the decidual basalis and junctional zone (JZ). (i) a magnified part of labyrinth zone. (b, f, and j) Showing effect of RA treatment on the utero-placental development, note that irregular shape of placenta with inhibition of the development of both the junctional and labyrinth zones (Hx & E staining). (c, g, and k) illustrate the immunohistochemical localization of EGFR of the utero-placental unit from control group, note that EGFR is expressed at high level in the decidual basalis and the junctional zone, and at moderate level in the labyrinth zone. (d, h, l) showing the effect of RA on the expression level of EGFR. note that EGFR is expressed at moderate level in the decidual basalis and the giant cell layer of junctional zone, while the rest of junctional zone and labyrinth zone are devoid of immunoreaction. (m) Optical density of EGFR-positive areas in decidual basalis (DB), junctional zone (JZ) and labyrinth zone (LB). Density is expressed as the number of positive areas. **P < 0.01 compared with the control group. Blood sinuses (BS). Scale bar (a–d): 100 µm, (e–l): 50 µm.
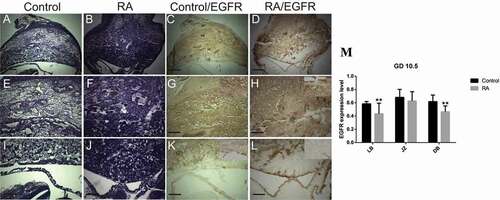
Figure 6. Photomicrographs of the transverse sections of the mice utero-placental units on gestation day (GD) 12.5 from control (a, e, i, c, g, k) and RA treated (b, f, j, d, h, l) groups. (a, e, i) Histology of the developed utero-placental unit from the control group showing, reduction of the thickness of decidual basalis (DB), while the thickness of junctional zone (JZ) and labyrinth zone (LB) is increased comparing to the previous stage (GD10.5). (e) a magnified part of the decidual basalis and junctional zone. (I) a magnified part of labyrinth zone. (b, f, and j) Showing effect of RA treatment on the utero-placental development, note the placenta is abnormal, with inhibition of the development of the labyrinth zones (white arrows), which is not demarcated from the junctional zone (Hx & E staining). (c, g, and k) illustrate the immunohistochemical localization of EGFR of the utero-placental unit from control group, note EGFR is weakly expressed in decidual basalis and junctional zone, and strongly expressed in the labyrinth zone. (d, h, l) showing the effect of RA on EGFR expression level; note RA induces reduction of EGFR expression level in decidual basalis(DB), junctional zone (JZ), and labyrinth zone (LB). (M) Optical density of EGFR-positive areas in decidual basalis (DB), junctional zone (JZ) and labyrinth zone (LB). Density is expressed as the number of positive areas. *P < 0.05 compared with the control group. Blood sinuses (BS). Scale bar (a–d): 100 µm, (e–l): 50 µm.
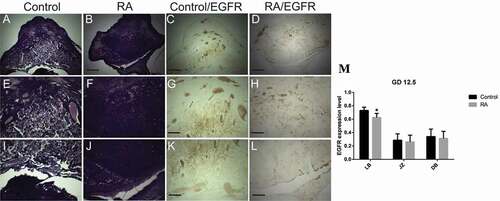
Figure 7. Photomicrographs of the transverse sections of the mice utero-placental units on gestation day (GD) 13.5 from control (a, e, i, c, g, k) and RA treated (b, f, j, d, h, l) groups. (a, e, i) Histology of the developed utero-placental unit from the control group showing, reduction of the thickness of both decidual basalis (DB) and junctional zone (JZ), while the thickness of the labyrinth zone (LB) is increased comparing to the previous stage (GD10.5). (e) a magnified part of the decidual basalis and junctional zone (JZ). (i) a magnified part of labyrinth zone. (b, f, and j) Showing effect of RA treatment on the utero-placental development, note small size of the placenta with inhibition of the development of the labyrinth zones (Hx & E staining). (c, g, and k) illustrate the immunohistochemical localization of EGFR of the utero-placental unit from control group, note weak expression of EGFR in decidual basalis and junctional zone, while in labyrinth zone the expression is strong. (d, h, l) showing the effect of RA on EGFR, the expression level of EGFR is moderate in decidual basalis (DB), junctional zone (JZ), and labyrinth zone (LB). (M) Optical density of EGFR-positive areas in decidual basalis (DB), junctional zone (JZ) and labyrinth zone (LB). Density is expressed as the number of positive areas. *P < 0.05, **P < 0.01 compared with the control group. Scale bar (a–d): 100 µm, (e–l): 50 µm.
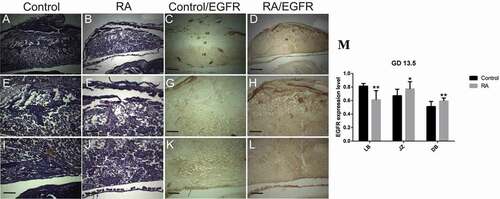
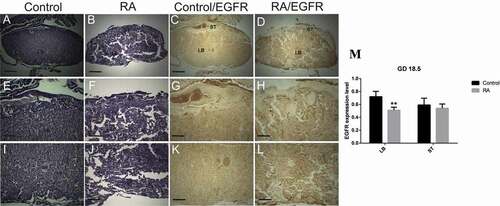
Figure 8. Photomicrographs of the transverse sections of the mice placentae on gestation day (GD) 18.5 from control (a, e, i, c, g, k) and RA treated (b, f, j, d, h, l) groups. (a, e, i) Histology of the placenta from the control group showing, reduction of the thickness of both decidual basalis (DB) and junctional zone (JZ), while the thickness of the labyrinth zone (LB) is increased comparing to the previous stage (GD13.5). (e) a magnified part of the spongiotrophoblast layer (ST). (i) a magnified part of labyrinth zone. (b, f, and j) Showing effect of RA treatment on placental development, note small size of the placenta with inhibition of the development of the labyrinth zones (Hx & E staining). (c, g, and k) illustrate the immunohistochemical localization of EGFR of the placenta from control group, note weak expression of EGFR in spongiotrophoblast layer, while in labyrinth zone the expression is strong. (d, h, l) showing the effect of RA on EGFR, the expression level of EGFR is moderate in spongiotrophoblast layer (ST), and labyrinth zone (LB). (m) Optical density of EGFR-positive areas in spongiotrophoblast layer (ST) and labyrinth zone (LB). Density is expressed as the number of positive areas. **P < 0.01 compared with the control group. Scale bar (a–d): 100 µm, (e–l): 50 µm.