
Figures & data
Figure 1. Effect of IQ on Kaplan- Meier survival plots in HCC mice.
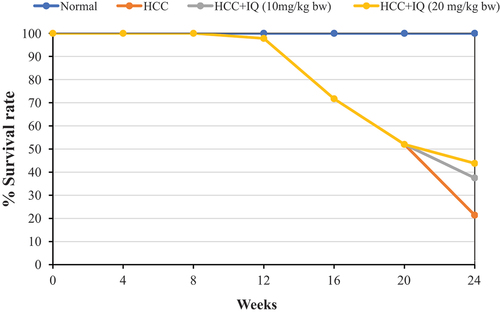
Table 1. Effect of IQ on serum hepatic biomarkers in HCC-bearing mice
Table 2. Effect of IQ on the nodular count, tumor marker AFP, hepatic MDA and TAC in HCC-bearing mice
Figure 2. A photomicrograph of a section of the liver of negative control mouse revealing normal architecture, with defined central vein (CV), and peripheral portal triad with hepatic portal vein (PV), bile ductule (BD), and hepatic artery (HA) (H & E x100).
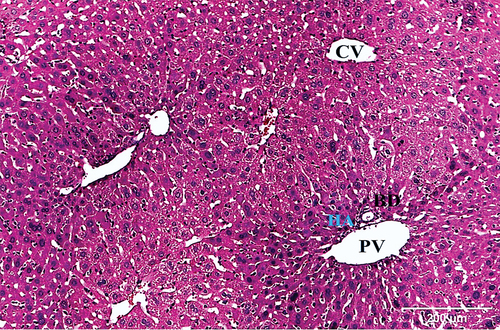
Figure 3. A photomicrograph of a liver section of negative control mouse showing hepatic lobule with central vein (CV), and radiated hepatic strands with 1–2 cell-thick polygonal hepatocytes (H), separated by sinusoids (S). The hepatocytes have either one nucleus (N) or binucleated (DN). Blood sinusoids are lined with endothelial cells (E) and scattered Kupffer cells (K) (H & E x400).
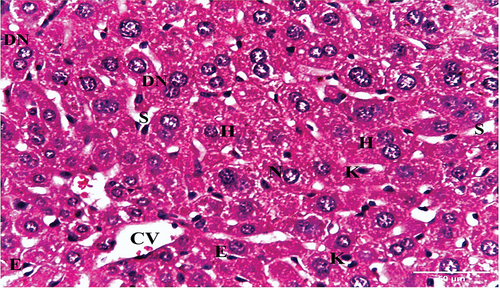
Figure 4. Photomicrograph of a liver section of HCC control group showing several nodules (asterisks) with indefinable radiated cell plates, and portal veins (PV) surrounded by inflammatory infiltrates (arrows) (HX&E X100).
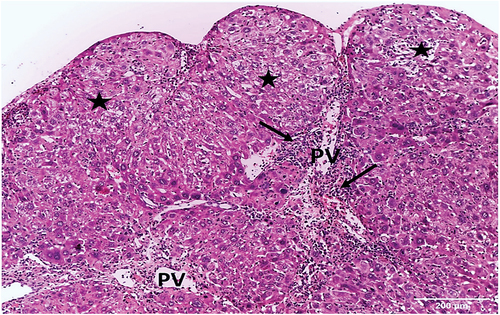
Figure 5. A photomicrograph of a liver section of HCC control group mouse showing altered liver tissue. The hepatic strands are disorganized, and the hepatocytes (H) are well-differentiated with eosinophilic cytoplasm. The nuclei are pleomorphic, relatively large, and some are dividing (DN). Portal vein (PV) with inflammatory infiltrate (arrows) and sinusoids (S) are also seen (HX & E x400).
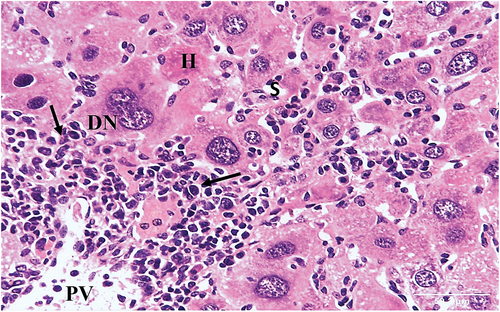
Figure 6. A photomicrograph of section of liver of HCC control group mouse showing significantly altered liver tissue. The hepatic strands are disorganized. The hepatocytes (H) are well-differentiated with eosinophilic cytoplasm. The nuclei are pleomorphic with prominent nucleoli (PN). Portal vein (PV) and compressed sinusoids (S) are also seen (HX & E x400).
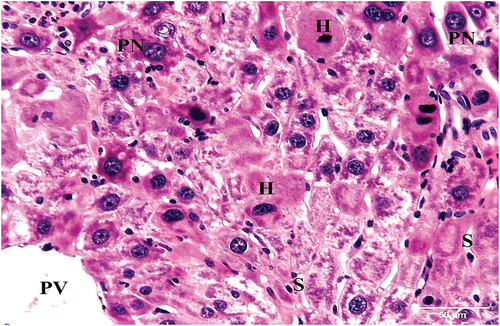
Figure 7. A photomicrograph of a section of liver of HCC treated with IQ (10 mg/kg bw) showing disorganized hepatic cords. Central vein (CV), Portal vein (PV) with bile ductule (BD) and congested sinusoids (S) are seen. Hepatocytes with vacuolated cytoplasm and mild inflammatory infiltrate (arrow) are also seen (H&E x100).
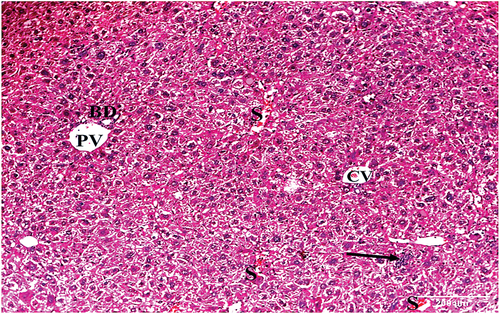
Figure 8. A photomicrograph of a liver section of HCC animals treated with IQ (10 mg/kg bw) showing portal vein (PV) with bile ductule (BD). The portal vein is surrounded by sinusoids (S) and hepatocytes (H) with vacuolated cytoplasm and central rounded nuclei (N) (H&E x400).
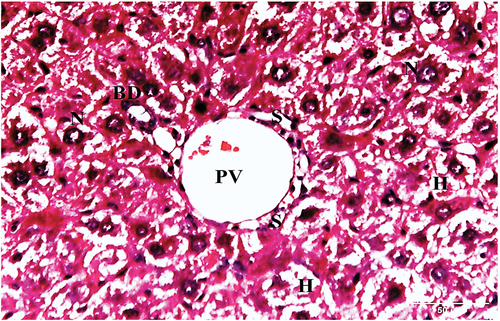
Figure 9. A photomicrograph of a liver section of HCC animals treated with IQ (20 mg/kg bw) showing central veins (CV), portal vein (PV), and bile ductule (BD). Hepatocytes with moderately vacuolated cytoplasm and mild inflammatory infiltrate (arrow) are also seen (H&E x100). ) A photomicrograph of a liver section of HCC animals treated with IQ (20 mg/kg bw) showing central vein (CV), blood sinusoids (S), hepatocytes (H) with moderately vacuolated cytoplasm, and central rounded nuclei (N). Kupffer cells (K) are also seen (H&E x400).
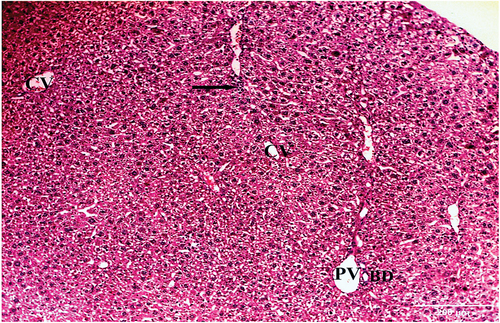
Figure 10. A photomicrograph of a liver section of HCC animals treated with IQ (20 mg/kg bw) showing central vein (CV), blood sinusoids (S), hepatocytes (H) with moderately Figure vacuolated cytoplasm, and central rounded nuclei (N). Kupffer cells (K) are also seen (H&E x400).
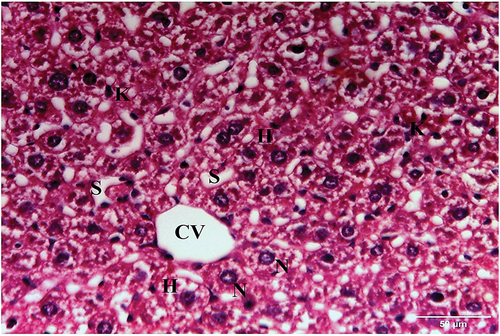
Figure 11. Photomicrographs showing P53 immuno-expression in (a) negative control, (b) HCC control group, (c) HCC+IQ [10 mg/kg bw] -treated group, and (d) HCC+ IQ [20 mg/kg bw]-treated group. Negative control (a) and HCC+IQ-treated groups (c, d) show barely detectable P53 in the hepatocytes nuclei, in comparison with the dense expression in HCC control group (b).
![Figure 11. Photomicrographs showing P53 immuno-expression in (a) negative control, (b) HCC control group, (c) HCC+IQ [10 mg/kg bw] -treated group, and (d) HCC+ IQ [20 mg/kg bw]-treated group. Negative control (a) and HCC+IQ-treated groups (c, d) show barely detectable P53 in the hepatocytes nuclei, in comparison with the dense expression in HCC control group (b).](/cms/asset/4d5c049f-4dcb-40a0-82da-da2d5a4bf724/teba_a_2079843_f0011_oc.jpg)
Table 3. Effects of IQ on the immunohistochemical expression in hepatic tissues of HCC-bearing mice
Figure 12. Photomicrographs showing PCNA immuno-expression in (a) negative control, (b) HCC control, (c) HCC+IQ [10 mg/kg bw] -treated and (d) HCC+IQ [20 mg/kg bw]-treated groups. Negative control section shows weak nuclear PCNA immunoreaction, while HCC control section shows strong positive nuclear immunoreaction. HCC+IQ [10 mg/kg bw]-treated group shows moderately positive nuclear immunoreaction, while HCC+IQ [20 mg/kg bw]-treated group shows positively mild nuclear immunoreaction.
![Figure 12. Photomicrographs showing PCNA immuno-expression in (a) negative control, (b) HCC control, (c) HCC+IQ [10 mg/kg bw] -treated and (d) HCC+IQ [20 mg/kg bw]-treated groups. Negative control section shows weak nuclear PCNA immunoreaction, while HCC control section shows strong positive nuclear immunoreaction. HCC+IQ [10 mg/kg bw]-treated group shows moderately positive nuclear immunoreaction, while HCC+IQ [20 mg/kg bw]-treated group shows positively mild nuclear immunoreaction.](/cms/asset/4ad45607-4b31-4e44-a3de-1b3d57886a1b/teba_a_2079843_f0012_oc.jpg)
Figure 13. Photomicrographs showing VEGF immuno-expression in (a) negative control, (b) HCC control group, (c) HCC+IQ 10 mg/kg bw -treated group and (d) HCC+IQ [20 mg/kg bw]-treated group. Negative control showing localized and weak VEGF immunoreactivity along the sinusoids and portal vessels, while in HCC control group VEGF is diffuse in strong positive immunoreactivity along with hepatocytic cytoplasm, endothelial cells, sinusoids, and portal vein. HCC+IQ [10 mg/kg bw] -treated group showing localized VEGF immunoreactivity along the sinusoids and there are some sporadic cells still have the stain, while in HCC+IQ [20 mg/kg bw]-treated group there is weak localized VEGF immunoreactivity along the sinusoids and portal vessels.
![Figure 13. Photomicrographs showing VEGF immuno-expression in (a) negative control, (b) HCC control group, (c) HCC+IQ 10 mg/kg bw -treated group and (d) HCC+IQ [20 mg/kg bw]-treated group. Negative control showing localized and weak VEGF immunoreactivity along the sinusoids and portal vessels, while in HCC control group VEGF is diffuse in strong positive immunoreactivity along with hepatocytic cytoplasm, endothelial cells, sinusoids, and portal vein. HCC+IQ [10 mg/kg bw] -treated group showing localized VEGF immunoreactivity along the sinusoids and there are some sporadic cells still have the stain, while in HCC+IQ [20 mg/kg bw]-treated group there is weak localized VEGF immunoreactivity along the sinusoids and portal vessels.](/cms/asset/91005d66-411f-4f74-8f4f-38939ac8b78b/teba_a_2079843_f0013_oc.jpg)