
Figures & data
Table 1. Comparison between patient group and control group as regards ET-1 serum level by (ng/l).
Table 2. Comparison between patient group and control group as regards MTT, CBV and CBF in NAWM.
Table 3. Comparison between patient group and control group as regards MTT, CBV and CBF in deep gray matter (DGM).
Figure 1. Correlation between serum levels of ET-1 and EDSS.
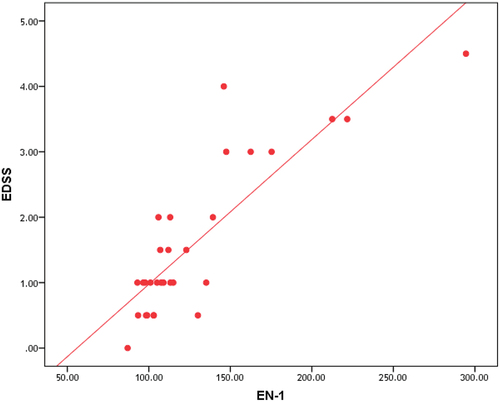
Table 4. Correlation between ET-1 and EDSS, duration of illness and number of attacks in patients group.
Table 5. Correlation between EDSS, MTT, CBV and CBF in NAWM in patients group.
Table 6. Correlation between EDSS and MTT, CBV and CBF in DGM of patients group.
Figure 2. Correlation between serum levels of ET-1 and (CBF) in NAWM.
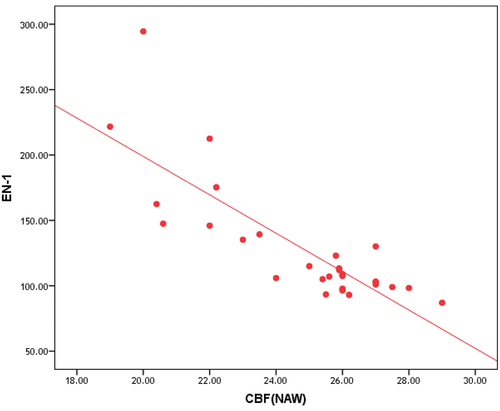
Figure 3. Correlation between serum levels of ET-1 and (CBF) in DGM.
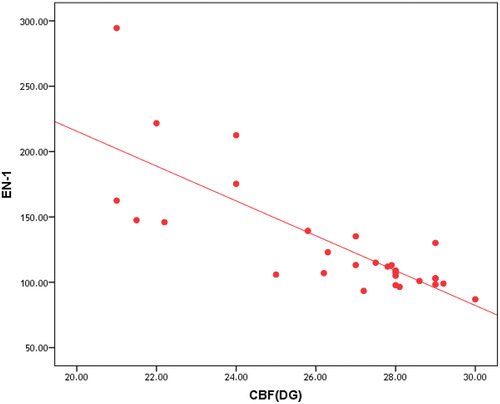
Figure 4. Cerebral blood flow (CBF) and mean transit time (MTT) color-coded maps in MS patient show decreased perfusion with decreased CBF and increased MTT (black arrows).
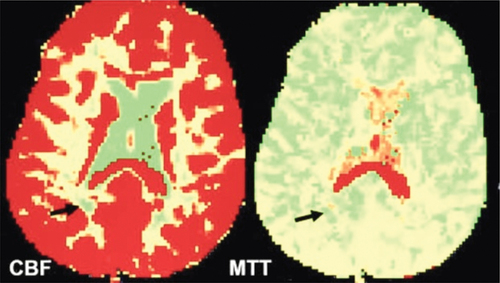
Figure 5. Cerebral blood flow (CBF) and cerebral blood volume (CBV) color-coded maps in MS patient with white matter lesion show perfusion changes in comparison to contralateral normal-appearing white matter (NAWM).
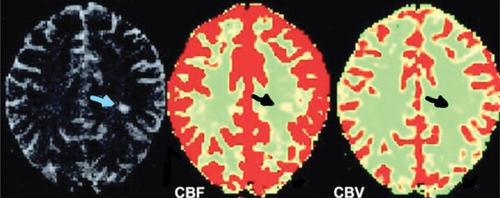
Table 7. Correlation between ET-1 and MTT, CBV and CBF in NAWM of patients group.
Table 8. Correlation between ET-1 and MTT, CBV and CBF in DGM of patients group.