Figures & data
Table 1. Comparison of percentage of atherosclerotic aortic lesions.
Table 2. Correlation (r) between aortic lesion area percentage, serum lipid profile and oxidized low-density lipoprotein.
Figure 1. Effect of trihoney on quantity of atherosclerotic plaques.
Study using Sudan IV staining. Thick arrow indicating the atherosclerotic lesion. Control Group (C). High Cholesterol Diet Group (HCD). Group Received Trihoney 0.3/kg/day (HCD+H1). Group Received Trihoney 0.6/kg/day (HCD+H2). Group Received Atorvastatin 2 mg/kg/day (HCD+At).
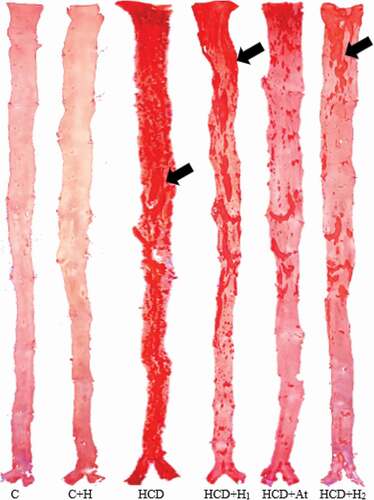
Table 3. Comparison of atherosclerotic plaque thickness, and tunica intima/Tunica media thickness ratio.
Table 4. Correlation (r) between atherosclerotic plaque thickness, tunica intima/Tunica media thickness ratio and serum lipid profile.
Figure 2. Photomicrographs of aorta H&E staining.
Control Group (C). High Cholesterol Diet Group (HCD). Group Received Trihoney 0.3/kg/day (HCD+H1). Group Received Trihoney 0.6/kg/day (HCD+H2). Group Received Atorvastatin 2 mg/kg/day (HCD+At).
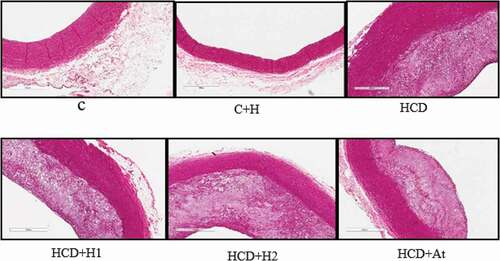
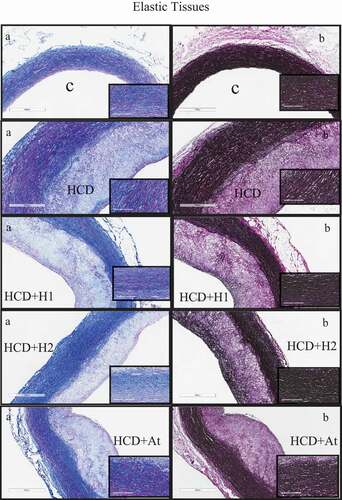
Figure 3. Study of atherosclerotic plaque using special stains demonstrating collagen and elastic tissues.
Photomicrograph of Aorta Histology from Control Group (C). High Cholesterol Diet Group (HCD). Group Received Trihoney 0.3/kg/day (HCD+H1). Group Received Trihoney 0.6/kg/day (HCD+H2). Group Received Atorvastatin 2 mg/kg/day (HCD+At). MT stain (A), VGS stain (B). 50× magnification. High power section (200× magnification) demonstrated at right lower angle.