
Figures & data
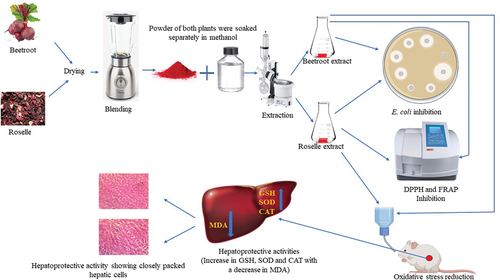
Table 1. In vitro antioxidant activities and bioactive compounds of the methanolic extracts of Roselle and beetroot.
Table 2. Antibacterial screening of the methanolic extracts of Roselle and beetroots against E. coli.
Figure 1. GSH (mg/g protein) activities of the livers of rats administered with varying concentrations of methanolic extracts of Roselle and beetroots against induced CCl4 and E. coli. Values represent mean ± SE of three independent experiments (n = 4). * Indicates significant difference (decrease) relative to the control groups at P < 0.001, ** indicates significant difference (increase) relative to Group 7, the untreated group in which CCl4 was induced at P < 0.05 and ## indicates significant difference (increase) relative to Group 7a, the untreated group in which E. coli was induced at P < 0.05.
Figure 2. SOD (U/mg protein) activities of the livers of rats administered with varying concentrations of methanolic extracts of Roselle and beetroots against induced CCl4 and E. coli. Values represent mean ± SE of three independent experiments (n = 4). * Indicates significant difference (decrease) relative to the control groups at P < 0.001, ** indicates significant difference (increase) relative to Group 7, the untreated group in which CCl4 was induced at P < 0.05 and ## indicates significant difference (increase) relative to Group 7a, the untreated group in which E. coli was induced at P < 0.05.
Figure 3. CAT (U/mg protein) activities of the livers of rats administered with varying concentrations of methanolic extracts of Roselle and beetroots against induced CCl4 and E. coli. Values represent mean ± SE of three independent experiments (n = 4). * Indicates significant difference (decrease) relative to the control groups at P < 0.001, ** indicates significant difference (increase) relative to Group 7, the untreated group in which CCl4 was induced at P < 0.05 and ## indicates significant difference (increase) relative to Group 7a, the untreated group in which E. coli was induced at P < 0.05.
Figure 4. MDA (nmol/g protein) activities of the livers of rats administered with varying concentrations of methanolic extracts of Roselle and beetroots against induced CCl4 and E. coli. Values represent mean ± SE of three independent experiments (n = 4). * Indicates significant difference (increase) relative to the control groups at P < 0.001, ** indicates significant difference (decrease) relative to Group 7, the untreated group in which CCl4 was induced at P < 0.05 and ## indicates significant difference (decrease) relative to Group 7a, the untreated group in which E. coli was induced at P < 0.05.
Figure 5. Representative Plates A – G: Liver histology showing hepatoprotective activities of the methanolic extracts of Roselle and beetroot against carbon tetrachloride (CCl4)-induced rats as observed in magnification (×400).
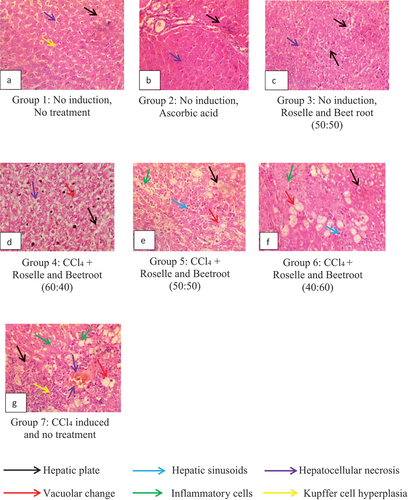
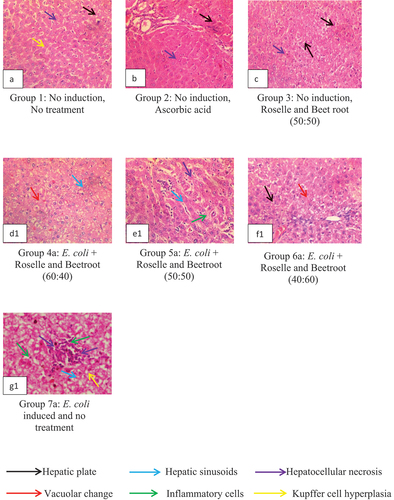
Figure 6. Representative Plates A – G1: Liver histology showing hepatoprotective activities of the methanolic extracts of Roselle and beetroot against E. coli-induced rats as observed in magnification (×400).
Data Availability Statement
All data generated or analyzed during this study are included in this published article (and its supplementary information files).