Figures & data
Figure 1. Effect of glucosamine on the activity of erythrocyte membrane transporters: (A) Na+/K+-ATPase activity (µmol Pi/mg protein/hour), (B) Ca2+ -ATPase activity (µmol Pi/mg protein/hour) in young, D-gal induced and naturally aged rats. The values are given as mean ± SEM (where n = 6). *p < 0.05 when the value is compared with young control, $p < 0.05 when the value is compared with D-Gal control, #p < 0.05 when the value is compared with naturally old control rats.

Figure 2. (A) Effect of glucosamine on erythrocyte NHE activity (mmol/L RBC/hour at 37°C)], (B) intracellular calcium ion (nM) in young, D-gal induced and naturally aged rats. The values are given as mean ± SEM (where n = 6). Where * p < 0.05 when the value is compared with young control, $ p < 0.05 when the value is compared with D-Gal control, # p < 0.05 when the value is compared with naturally old control rats.
![Figure 2. (A) Effect of glucosamine on erythrocyte NHE activity (mmol/L RBC/hour at 37°C)], (B) intracellular calcium ion (nM) in young, D-gal induced and naturally aged rats. The values are given as mean ± SEM (where n = 6). Where * p < 0.05 when the value is compared with young control, $ p < 0.05 when the value is compared with D-Gal control, # p < 0.05 when the value is compared with naturally old control rats.](/cms/asset/bb1a8c3c-f769-4c0c-9479-4730ce3ad554/teba_a_2099116_f0002_oc.jpg)
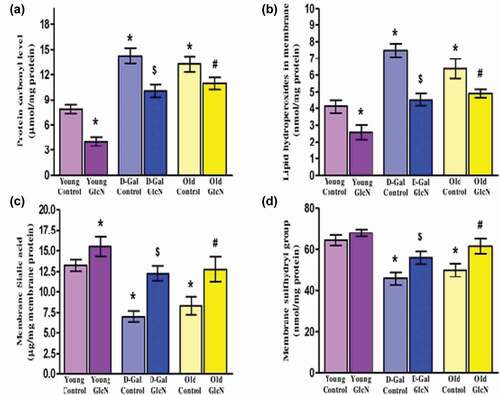
Figure 3. Restorative potential of glucosamine on biomarkers of oxidative stress in erythrocyte membrane: (A) Protein carbonyl levels (µmol/mg protein), (B) Lipid hydroperoxides (nmol/mg protein), (C) Membrane sialic acid (µg/mg membrane protein), and (D) Membrane sulfhydryl group (nmol/mg protein) in young, D-Gal induced and naturally aged rats. The values are given as mean ± SEM (where n = 6). *p < 0.05 when the value is compared with young control, $p < 0.05 when the value is compared with D-Gal control, #<0.05 when the value is compared with naturally old control rats.