
Figures & data
Figure 1. Detection of IDH1 c.395 G˃A mutation by RFLP-PCR analysis. Numbers refer to lanes. Lane 1 shows 50 bp DNA ladder. [A] Lane 2 showed PCR amplification product (undigested) with band at 261 bp; Lanes 3–9 showed single band at 237bp corresponding to wild type IDH1. [B] Lane 2–7 showed mutant variant of IDH1 with appearance of two closely placed bands (261 bp and 237 bp).
![Figure 1. Detection of IDH1 c.395 G˃A mutation by RFLP-PCR analysis. Numbers refer to lanes. Lane 1 shows 50 bp DNA ladder. [A] Lane 2 showed PCR amplification product (undigested) with band at 261 bp; Lanes 3–9 showed single band at 237bp corresponding to wild type IDH1. [B] Lane 2–7 showed mutant variant of IDH1 with appearance of two closely placed bands (261 bp and 237 bp).](/cms/asset/4e0a4106-6f40-4b70-a934-43f41fde946b/teba_a_2104073_f0001_oc.jpg)
Table 1. Circulating neuroglobin in patients with traumatic brain injury (TBI) in terms of severity and outcome.
Figure 2. Negative correlation between serum NGB levels and GCS, (r = −0.498, p = 0.005).
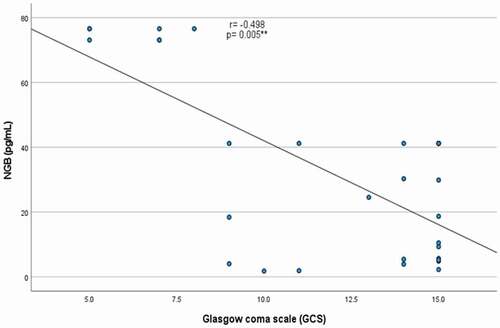
Figure 3. Negative correlation between serum NGB levels and RTS, (r = −0.521, p = 0.003).
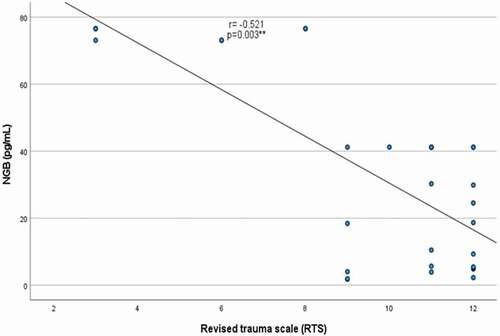
Figure 4. ROC Characteristic Curve for serum neuroglobin (pg/mL) in patients with traumatic brain injury. [A] For predicting the severity of TBI. [B] For predicting the outcome of TBI.
![Figure 4. ROC Characteristic Curve for serum neuroglobin (pg/mL) in patients with traumatic brain injury. [A] For predicting the severity of TBI. [B] For predicting the outcome of TBI.](/cms/asset/7dc93733-a702-4ad0-8824-5667f0f0d838/teba_a_2104073_f0004_oc.jpg)
Table 2. Correlation of serum neuroglobin with severity and outcome scores in patients with traumatic brain injury.
Table 3. Genotypes frequencies of IDH1 gene in patients with traumatic brain injury in terms of severity.
Table 4. Genotypes frequencies of IDH1 gene in patients with traumatic brain injury in terms of outcome.