Figures & data
Figure 1. Chemical structure of potential inhibitors of anti-apoptotic BCL-2 proteins (a) ursolic acid, (b) β -Sitosterol, (c) luteolin, (d) apigenin 7,4’-dimethyl ether, and (e) basilimoside.
Table 1. Interacting amino acid residue of anti-apoptotic BCL-2 proteins with top docked compounds.
Figure 2. Details of binding mode (a) solvent-accessible surface view (b) interaction view of ligands in BH3 binding pocket of Bcl-2. Stick representations of the Ligands are shown by colors (bi) blue: β-Sistosterol (bii) red: Ursolic acid (biii) green: navitoclax (referencer inhibitors). : Types of interactions are represented by Green-dotted lines: H-bonds; light purple-dotted line: hydrophobic interactions (Pi-Alkyl, Alkyl and pi-stacking); purple-dotted line: Pi-Pi T Shaped; yellow-dotted lines: Pi-sulfur interactions, pi-stacking interactions, with three-letter abbreviations of amino acids.
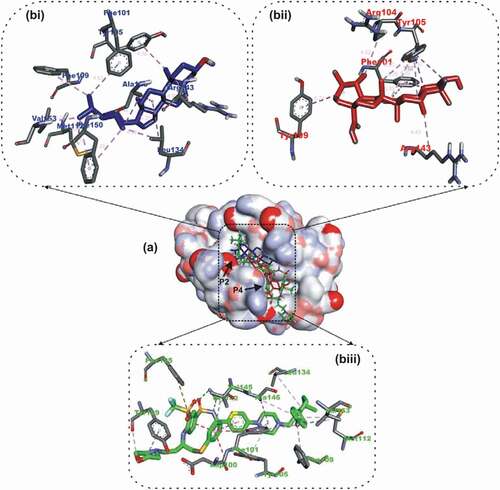
Figure 3. Details of binding mode (a) solvent-accessible surface view (b) interaction view of ligands in BH3 binding pocket of Bcl- XL. Stick representations of the Ligands are shown by colors (bi) blue: Luteolin (bii) red: Apigenin 7,4’,dimethyl ether (biii) green: WEHI_539 (referencer inhibitors).
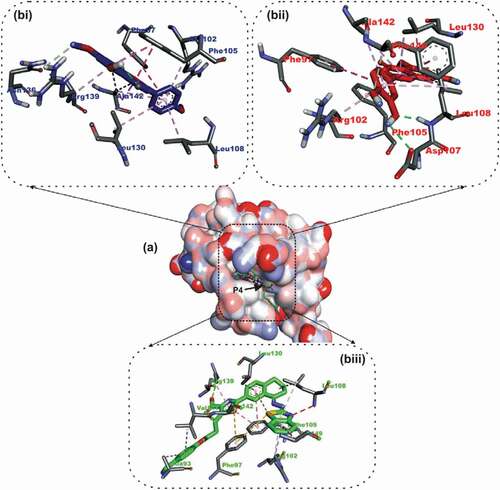
Figure 4. Details of binding mode (a) solvent-accessible surface view (b) interaction view of ligands in BH3 binding pocket of Mcl-1. Stick representations of the Ligands are shown by colors (bi) blue: Ursolic acid (bii) red: luteolin (biii) green: Gambogic Acid (referencer inhibitors).
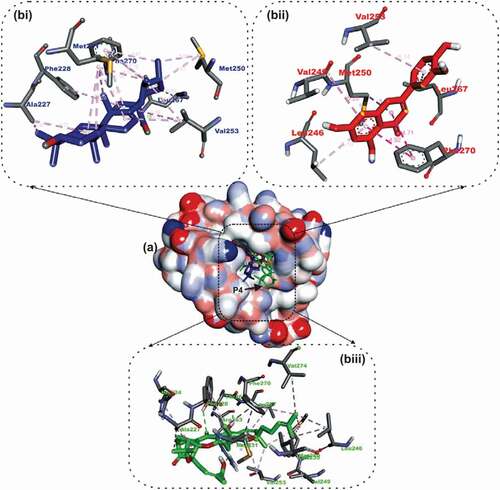
Figure 5. Details of binding mode (a) solvent-accessible surface view (b) interaction view of ligands in BH3 binding pocket of Bfl-1. Stick representations of the Ligands are shown by colors (bi) blue: ursolic acid (bii) red: basilimoside.
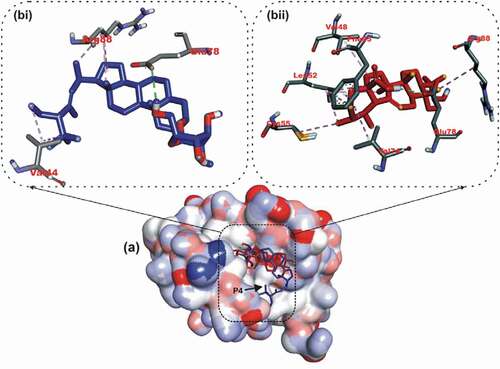
Figure 6. Details of binding mode (a) solvent-accessible surface view (b) interaction view of ligands in BH3 binding pocket of Bcl-A1. Stick representations of the Ligands are shown by colors (bi) blue: ursolic acid (bii) red: β – Sitosterol.
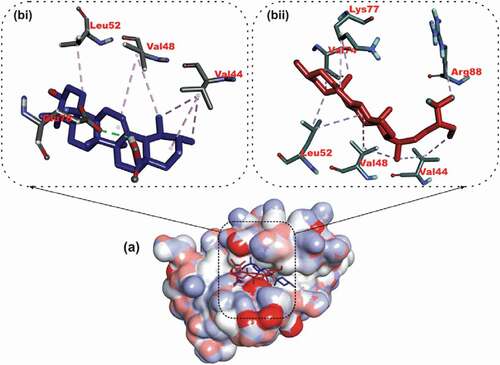
Figure 7. The Surface Accessible Surface Area (SASA) plots of molecular dynamics (MD) simulation of anti-apoptotic BCL-2 proteins (APB2P) (A) BCL-XL (B) BCL-2. Blue line: Apo protein, Pale Orange line: Complexes of APB2P with top dock phytochemicals (A: Luteolin and B: Ursolic acid).
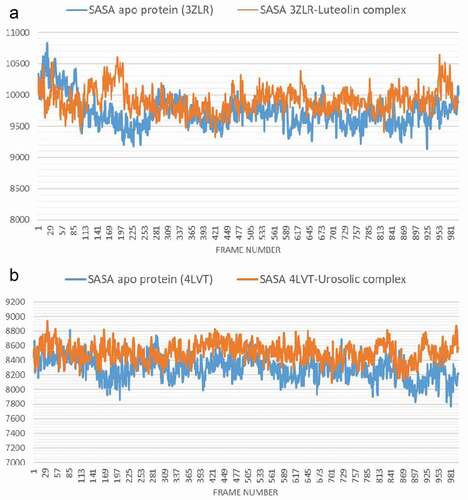
Figure 8. The Radius of gyration (RoG) plots of molecular dynamics (MD) simulation of anti-apoptotic BCL-2 proteins (APB2P) (A) BCL-XL (B) BCL-2. Blue line: Apo protein, Pale Orange line: Complexes of APB2P with top dock phytochemicals (A: Luteolin and B: Ursolic acid).
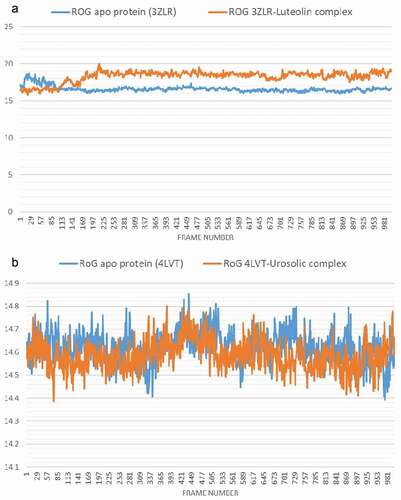
Figure 9. The Backbone-Root Mean Square Deviation (RMSD) plots of molecular dynamics (MD) simulation of anti-apoptotic BCL-2 proteins (APB2P) (A) BCL-XL (B) BCL-2. Blue line: Apo protein, Pale Orange line: Complexes of APB2P with top dock phytochemicals (A: Luteolin and B: Ursolic acid).
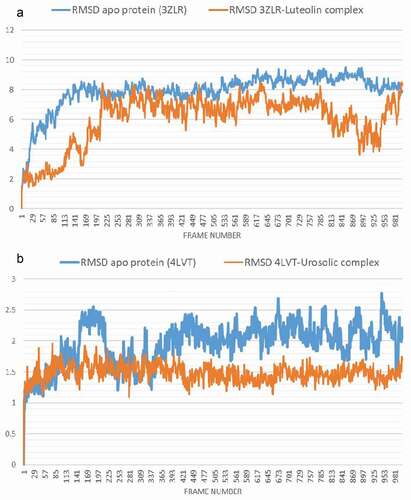
Figure 10. Per residue Root Mean Square Fluctuations (RMSF) plots of molecular dynamics (MD) simulation of anti-apoptotic BCL-2 proteins (APB2P) (A) BCL-XL (B) BCL-2. Blue line: Apo protein, Pale Orange line: Complexes of APB2P with top dock phytochemicals (A: Luteolin and B: Ursolic acid).
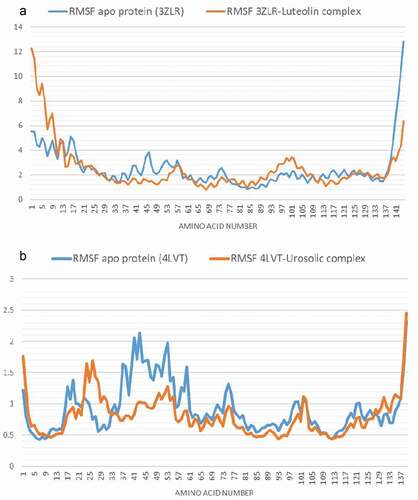
Figure 11. The changes in the number of H-bonds during the MDS trajectory of anti-apoptotic BCL-2 proteins (APB2P) (A) BCL-XL (B) BCL-2. Blue line: Apo protein, Pale Orange line: Complexes of APB2P with top dock phytochemicals (A: Luteolin and B: Ursolic acid).
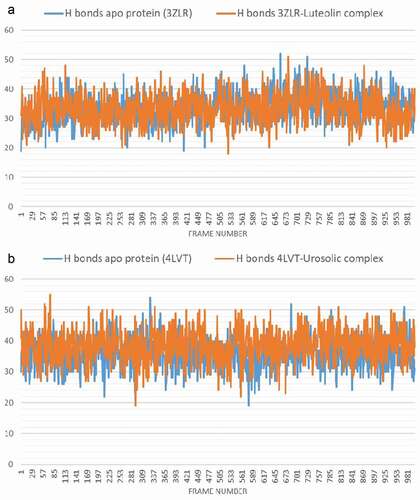
Figure 12. Molecular mechanics/Poisson-Boltzmann surface area (MM/PBSA) plot of binding free energy contribution per residue of (A) BCL-XL – Luteolin complex and (B) BCL-2- Ursolic acid complex.
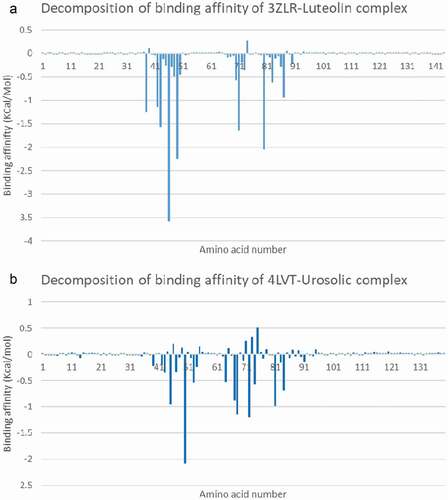
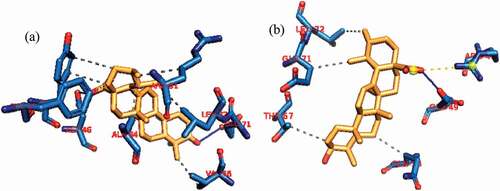
Figure 13. Interactions in human BCL-XL -Luteolin complex (a) cluster 1 and (b) cluster 4. Grey dotted dashed lines: hydrophobic interactions; Blue solid line: Hydrogen bond. Amino acids are in one-letter format and blue color. Luteolin is in Orange stick representation.
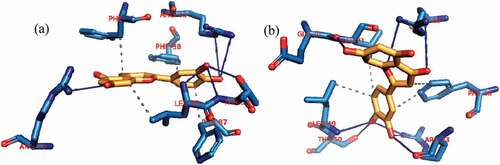
Figure 14. Interactions in human BCL-2-ursolic acid complex (a) cluster 1 and (b) cluster 4. Grey dotted dashed lines: hydrophobic interactions; Blue solid line: Hydrogen bond. Amino acids are in one-letter format and blue color. Ursolic acid is in Orange stick representation.