Figures & data
Table 1. List of the real time PCR primers.
Table 2. Phytochemicals content and antioxidant activity of different peanuts extracts.
Figure 1. Histopathological changes of cerebral cortex and hippocampus of diabetic and peanut treated rats (a). Photomicrographs of sagittal histological section of cerebral cortex. A. Control. A1. Dietary peanut supplementation. B-B3. Diabetes showing blood vessel infiltration, glial cell condensation, angiogenesis of blood vessels, glial cell infiltration and gliosis. C-C1. Diabetes and Peanut supplementation. Note the improvement of the cerebral cortex. Abbreviations; BVI, blood vessel infiltration; Gl, gliosis. Star illustrated apoptotic neuronal cells. I. Molecular layer. II. External granular layer. III. Pyramidal layer. IV. Inner granular layer. (b) Photomicrographs of sagittal histological section of hippocampus of male rat. A. Control. B. Dietary peanut supplementation. C. Diabetes showing chromatolysis or grouping nuclear chromatin (apoptosis) of pyramidal cells. D. Diabetic and dietary supplemented Peanut showing an improvement.Abbreviations; ML, molecular layer, PL, polymorphic layer; PyL, pyramidal layer.
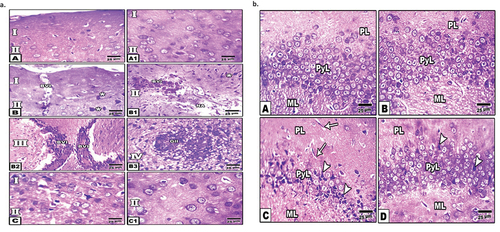
Figure 2. Transmission Electron micrographs of cerebral cortex. (a) TEM of control. A -C. Showed normal pyramidal cell with nuclei having peripheral heterochromatin, and euchromatin containing vesicular nucleoli and thin cytoplasm containing rich RER, and mitochondria. D. Showing non-myelinated axons. Abbreviations; M, mitochondria, NMA, non-myelinated axon; N, nucleus, NE, nuclear envelope; Nu, nucleolus; RER, rough endoplasmic reticulum. (b) TEM of cerebral neurons of diabetic rat. A - B. Showed Pyramidal cell with nuclei having densely compacted heterochromatin and cytoplasm with vesiculated rough endoplasmic reticulum and atrophied mitochondria. C. Showed congested blood capillaries. D. showed widespread of demyelinated axons. Abbreviations; DM; damaged mitochondria; DMA, demyelinated axons; KN, karyolitic nuclei; PN, pyknotic nuclei. (c) Transmission electron micrographs of cerebral cortex of diabetic rat received dietary peanut. A-C. Showed an improvement at pyramidal cells with peripheral heterochromatin and cytoplasm containing rich RER, and mitochondria. Arrow head in figure A. showed satellite cells present adjacent to some neurons. D. Showed the myelinated axons.
Figure 3. (a) Photomicrographs of immunohistochemical localization of caspase 3 at cerebrum (A1-D1) and hippocampus (A2-D2). Note the negative immune reaction in control and peanut supplementation (N). Diabetic cerebrum (C1) and Diabetic hippocampus (C2) showed an increased expression of caspase-3 in neuronal cells. Diabetic and peanut treated cerebrum (D1) and hippocampus (D2) showed a downregulation at caspase-3 expression. Abbreviations; D+N, diabetic and peanuts; N, peanut. Star pointed out the increased immune reaction. (b) Histogram illustrating Image analysis of caspase 3 immunolabeling in cerebrum and hippocampus. Showed the significant overexpression of caspase 3 in diabetic group compared to control group. This elevation at caspase-3 was significantly downregulated by peanut treatment. Each result represent the mean ± SD (n = 5); * indicated the significance at p < 0.05 compared to the control. $ indicated the significance at p < 0.05 compared to the diabetic group. Abbreviations; C, Control; D, diabetes; N, Peanut.
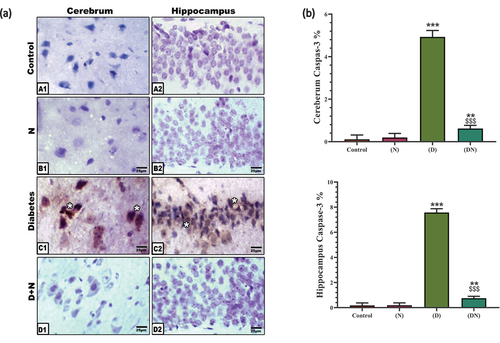
Figure 4. (a) Photomicrographs of immunolocalization of synaptophysin at cerebrum (A1-D1) and hippocampus (A2-D2). Note moderate immune reaction in control and peanut supplementation (N) in cerebrum and hippocampus. (C1-C2). Diabetic cerebrum (C1) and hippocampus (C2) showed a decreased expression of synaptophysin in neuronal cells. (D1-D2). Diabetic and peanut treated cerebrum (D1) and hippocampus (D2) showed an improvement at immune reaction. Arrow head pointed out the synaptophysin immune reaction. Star pointed out the decreased immune reaction. (b) Chart illustrating Image analysis of synaptophysin immunostaining of cerebrum and hippocampus indicated a significant decrease at the expression of synaptophysin in diabetic group compared to control group which was significantly over-countered by peanut supplementation. Each result represent the mean ± SD (n = 5); * indicated the significance at p < 0.05 compared to control. $ indicated the significance at p < 0.05 compared to diabetic group. Abbreviations; C, Control; D, diabetes; D+N, diabetes and peanut; N, Peanut.
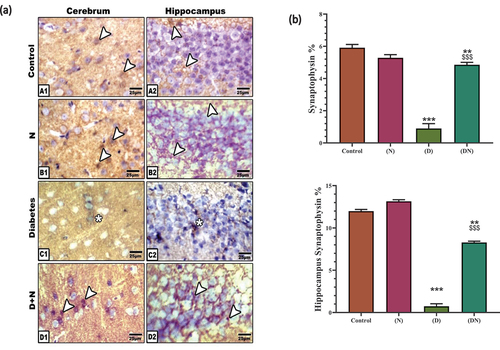
Figure 5. Histogram illustrating the effect of Diabetes and/or peanut supplementation on brain biochemical activity. Charts showed the diabetes dependent significant decrease at the brain SOD activity (a) increase of brain MDA content (b) decrease of brain dopamine content (c) decrease of brain serotonin content (d) increase of brain TNFα content (e) increase of brain 5-lipoxyginase content (f) decrease of brain ATP content (g) increase of brain 8-hydroxy-deoxy guanosine content (h) increase of brain amyloid-β content (i) increase of brain α- amylase content (j) increase at brain tau protein content (k) compared to control group. These levels showed a significant therapeutic improvement post-dietary supplementation of peanut (DN). Each result represented as the mean ± SD (n =7); * indicated the significance at p < 0.05 compared to control. $ indicated the significance at p < 0.05 compared to diabetic group. Abbreviations; C, Control; D, diabetes; N, Peanut; DN, diabetic and peanut supplemented group.
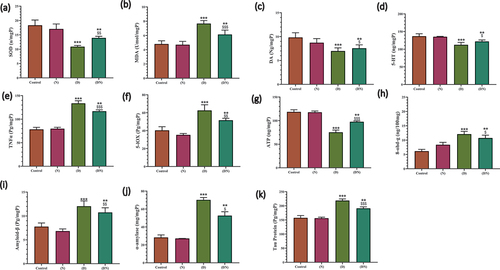
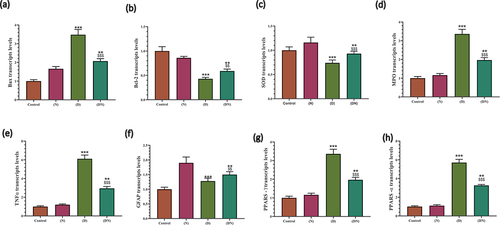
Figure 6. RT-PCR validation of peanut cytoprotective effect against diabetic related oxidative stress, inflammation, apoptosis and differentiation of brain neurons. Charts illustrated the significant effect of diabetes at RNA expression of BAX (a) Bcl-2 (b) SOD (c) MPO (d) TNFα (e) GFAP (f) PARP-γ (g) PARP-α (h) in brain of male rats, which was significantly opposed in rats that received dietary peanut (DN) compared to diabetic group. Each result represent the mean ± SD (n = 3); * indicated the significance at p < 0.05 compared to control group. $ indicated the significance at p < 0.05 compared to diabetic group. Abbreviations; C, Control; D, diabetes; N, Peanut; DN, diabetic and peanut supplemented group.