
Figures & data
Table 1. Chemical structures of the 2-((1 H-indol-3-yl)thio)-N-phenyl-acetamide derivatives along with their anti-IAV values.
Figure 1. Optimized structures (a) structure of compound 21, (b) alignment and superposition of the dataset compounds (capped sticks model).
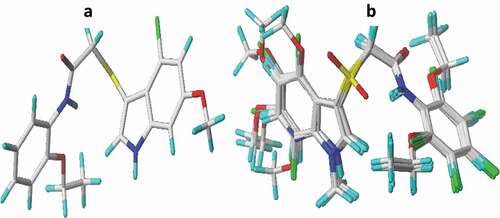
Table 2. Internal validation of the 2D-QSAR models.
Table 3. External validation parameters of the 2D-QSAR models.
Figure 2. RMSE values of training set against the number of epochs and number of neurons in the hidden layer (1 to 5).
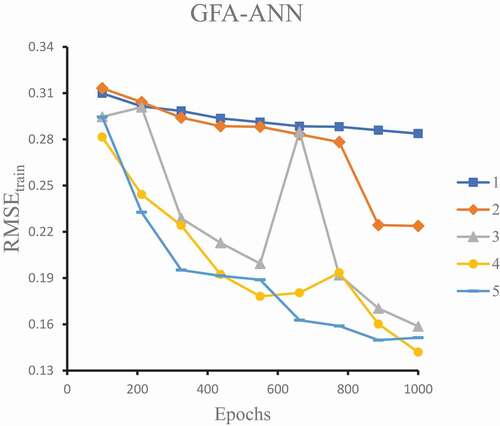
Figure 3. Schematic representation of the 5-4-1 neural architecture for the GFA-ANN model.
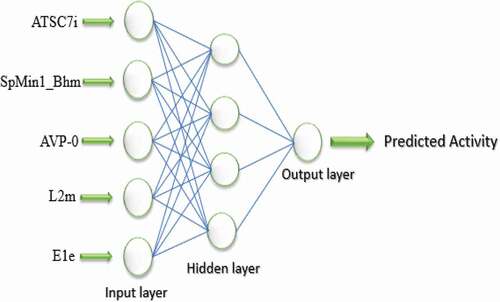
Figure 4. Relevance plot of the feature selected descriptors in the GFA-MLR and GFA-ANN models.
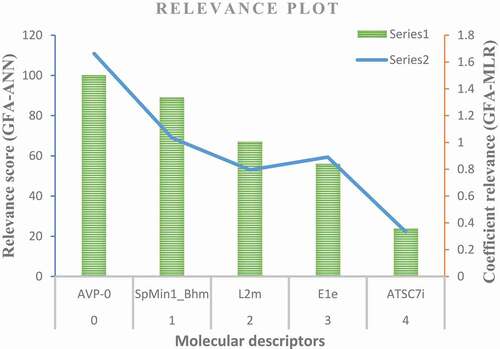
Figure 5. Scatter plot of the leverage scores against standardized residuals of the GFA-ANN model (Williams plot).
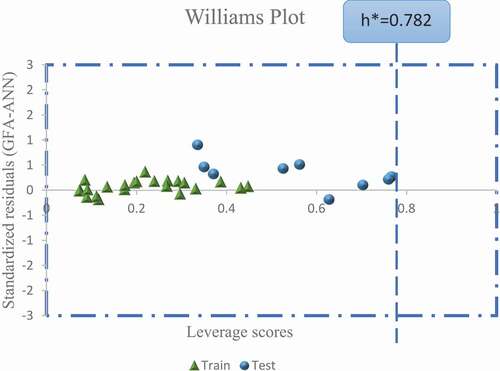
Table 4. Statistical validation results of probable CoMFA models.
Table 5. Statistical validation results of the best 3D-QSAR models.
Figure 6. 3D fields of the CoMFA model for the most active compound (21), (a) green area depict desirable steric bulk while yellow area disfavor steric bulk, (b) blue region favors positive charge and red region favors negative charge.
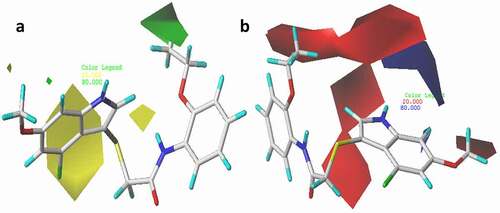
Figure 7. 3D fields contribution of the CoMSIA_EAD model for the most active compound (compound 21), (a) electrostatic contour map where blue region favor positive charge and red region favor negative charge, (b) magenta contour represent the region for desirable hydrogen bond acceptor while red area represents undesirable acceptor, (c) cyan contours represent the area for desirable hydrogen bond donor while purple area represents the undesirable donor.
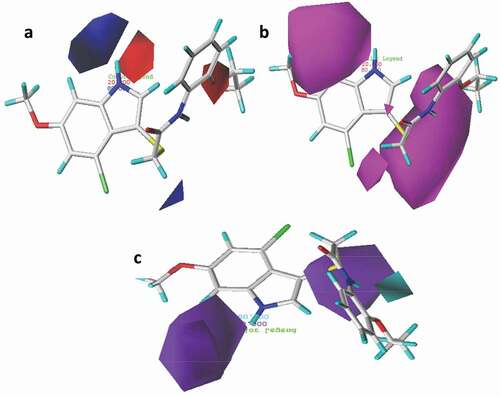
Figure 8. General description of the 3D QSAR analysis.
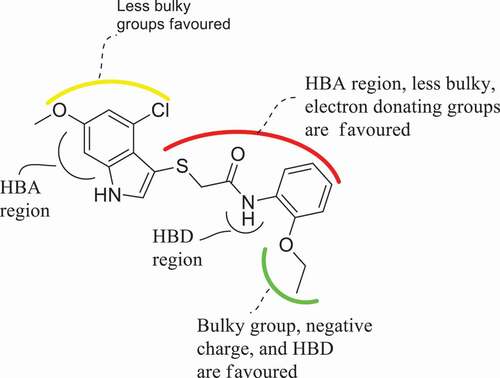
Table 6. Molecular docking scores of the 2-((1 H-indol-3-yl)thio) acetamide derivatives as anti-IAV agents.
Figure 9. 3D docking view of compound 16 with the H1N1 neuraminidase (PDB: 4B7Q): (a) the best pose of compound 16, (b) 3D hydrogen bond surfaces around the ligand, (c) 2D residual interaction of compound 21-complex.
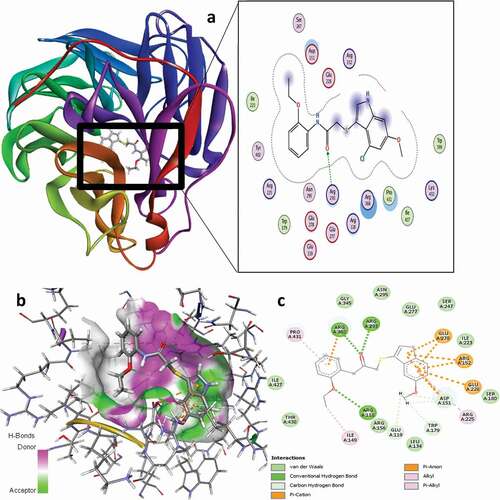
Figure 10. 3D docking view of compound 21 with the H1N1 neuraminidase (PDB: 4B7Q): (a) the best pose of compound 21, (b) 3D hydrogen bond surfaces around the ligand 21, (c) 2D residual interaction of compound 21-complex.
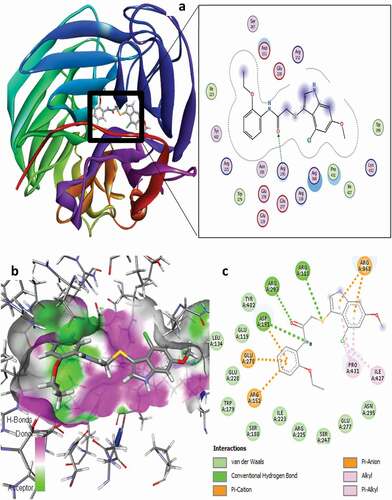
Table 7. Binding interaction of the H1N1 neuraminidase receptor with compound 16.
Table 8. Binding residual interaction of the H1N1 neuraminidase receptor with compound 21.
Figure 11. Physicochemical radar chart of the lead compounds.
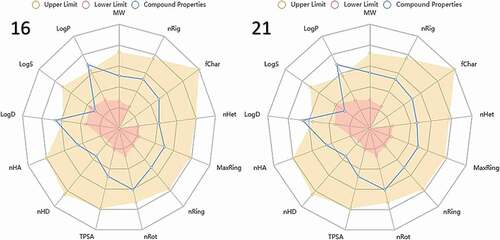
Table 9. Lipinski’s rule parameters of compounds 16 and 27.
Table 10. Drug-likeness evaluation of compounds 16 and 21 based on Ghose, Veber, Egan, Muegge, QED and SA scores.
Table 11. ADMET properties of the lead molecules in the dataset.