Figures & data
Figure 1. A representative graph of the experimental design.
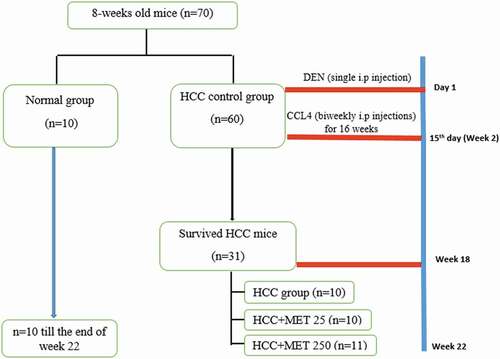
Table 1. Effect of metformin on liver relative weight and nodular count in HCC-bearing mice.
Figure 2. Effect of metformin on Kaplan-Meier survival curve in HCC-bearing mice.
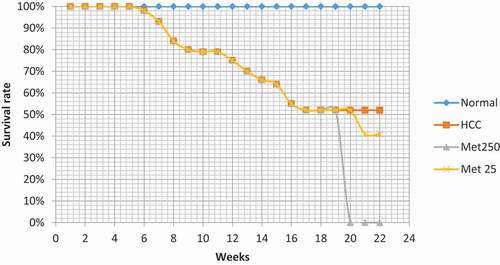
Figure 3. Liver gross morphology in HCC-bearing mice. (a) Normal, (b) HCC control, (c) HCC treated with metformin 25 mg/kg and (d) HCC treated with metformin 250 mg/kg.
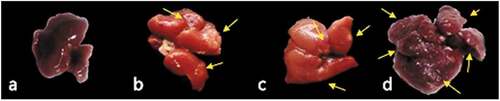
Table 2. Effect of Metformin on serum enzymatic hepatic parameters in HCC-bearing mice.
Table 3. Effect of metformin on serum non-enzymatic hepatic parameters in HCC-bearing mice.
Figure 4. Photomicrograph of sections of liver of negative control mice showing normal architecture. (a, c, & d) stained with Hx & E, (b) stained with silver nitrate. (a) shows each lobule has a central vein (CV) located in the center, (b) shows reticulin fibers distribution, (c) shows portal triad consisting of a branch of the portal vein (PV), a small branch of hepatic artery (ha) and a bile ductule (bd), (d) shows strands of hepatocytes separated by sinusoids around a central vein (cv).
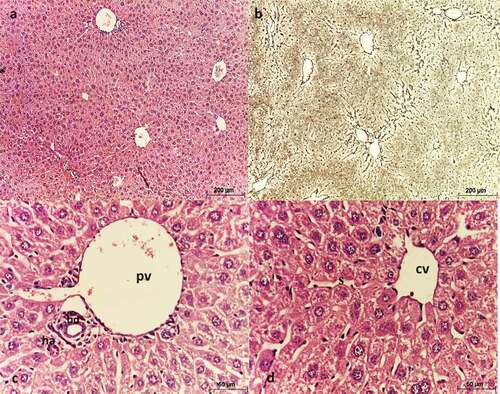
Figure 5. Photomicrograph of sections of liver of HCC control mice showing altered architecture of hepatic tissue. (a, c, & d) stained with Hx & E, (b) stained with silver nitrate. (a) shows the presence of nodules (arrows), (b) shows hepatic fibrosis and altered architecture, (c) shows the presence of unpaired arteries (arrows), and (d) shows pleomorphic hepatocytes (H), with strong eosinophilic cytoplasm and rounded nuclei with prominent nucleoli (arrowheads), along with macrovesicular steatosis (asterisks).
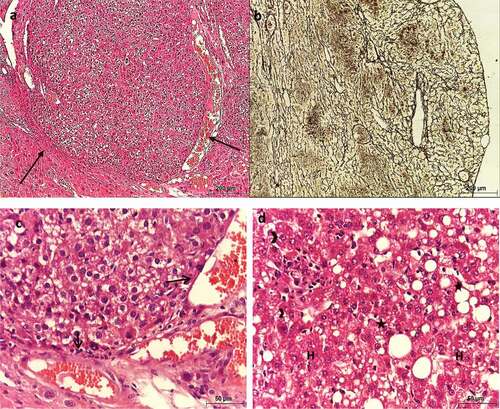
Figure 6. Photomicrograph of sections of liver of HCC mice treated with MET (25 mg/kg) showing slightly altered architecture. (a, c & d) stained with Hx & E. (b) stained with silver nitrate. (a) shows slightly altered architecture, (b) shows mild fibrosis, (c) shows polygonal hepatocytes with centrally located nuclei (n) with different sizes, apoptotic cell (arrow), and inflammatory cells were noticed near the central vein (asterisks), and (d) shows the histological structure of the portal area.
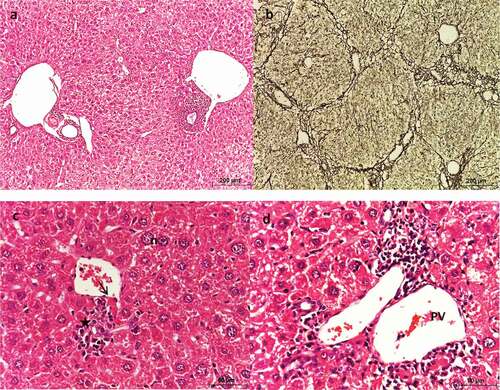
Figure 7. Photomicrograph of sections of liver of HCC mice treated with MET (250 mg/kg) showing altered architecture. (a & c) stained with Hx & E, (b) stained with silver nitrate. (a) shows hepatic lobules with numerous dilated portal veins and sinusoids. (b) shows fibrosis, (c) shows large and vacuolated hepatocytes (h) with large nuclei, and (d) shows dilated portal vein (PV), apoptotic cells (arrow) and periportal inflammation (asterisks).
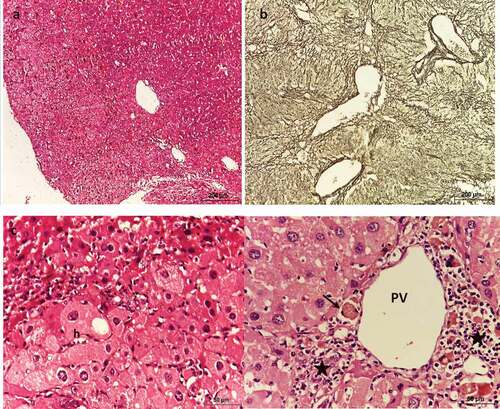
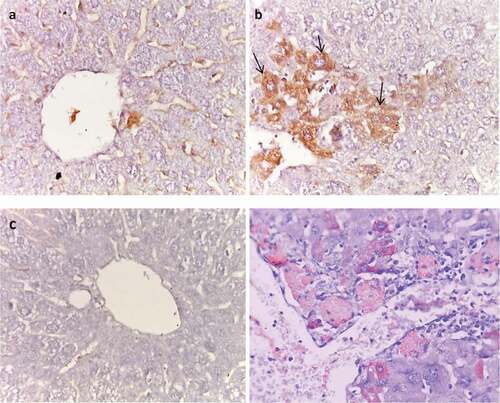
Figure 8. Effect of metformin on VEGF immunoreactivity. (a) Normal, (b) HCC control, (c) HCC- MET (25 mg/kg), (d) HCC- MET (250 mg/kg).
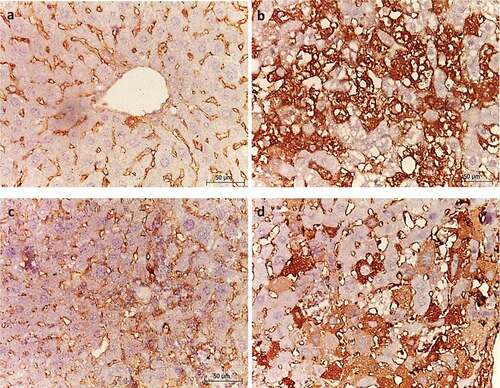
Figure 9. Effect of metformin on PCNA immunoreactivity. (a) Normal, (b) HCC control, (c) HCC- MET (25 mg/kg), and (d) HCC- MET (250 mg/kg). (Blue arrows resemble G1 and black arrows resemble S-phase).
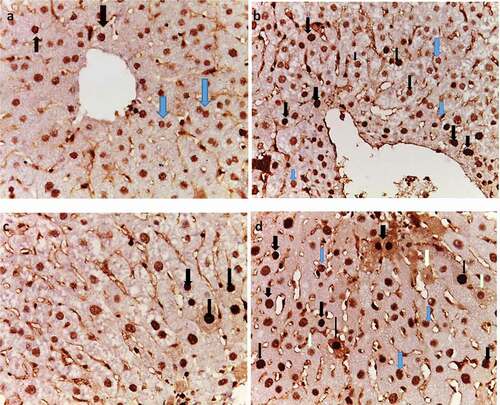
Figure 10. Effect of metformin on Bax immunoreactivity. (a) Normal, (b) HCC control, (c) HCC- MET (25 mg/kg); (arrows), and (d) HCC- MET (250 mg/kg).
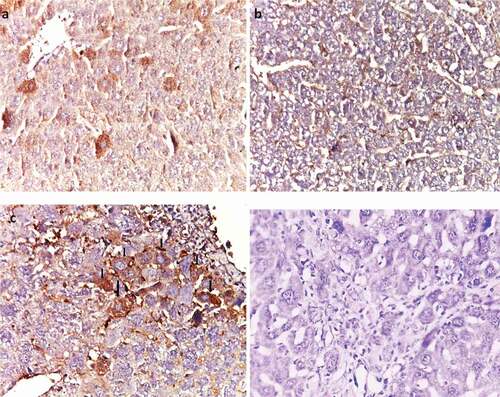
Figure 11. Effect of metformin on BCl2 immunoreactivity. (a) Normal, (b) HCC control (arrows), (c) HCC- MET (25 mg/kg), and (d) HCC- MET (250 mg/kg).