Figures & data
Table 1. General characteristic and serum experimental parameters.
Figure 1. Effect of hesperidin treatment on antioxidant levels in rats maintained on alternate day fasting. (1a) Antioxidant levels measured by FRAP levels reported in terms of µmol Fe/l plasma. * denotes significant increase (p < 0.05) in comparison with control group and # denotes significant increase (p < 0.05) when compared to ADF group. (1b) Erythrocyte glutathione (GSH) content in units mg/ml. * significantly higher (p < 0.05) when compared to control and # significantly higher (p < 0.05) with respect to ADF group. (1c) PMRS activity (μmole ferrocyanide/ml PRBC/30 min). * significantly higher (p < 0.05) compared to control group. Values are expressed as mean ±SD (n = 6) performed in duplicates. C- control; ADF- alternate day fasting; Hes- hesperidin; ADF+Hes- alternate day fasting+ hesperidin.
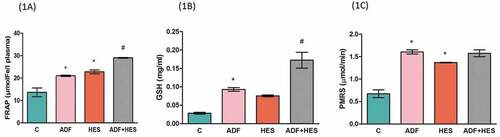
Figure 2. Effect of hesperidin supplementation on biomarkers of oxidative stress in rats. (2a) Malonyldehyde (MDA) content in erythrocytes in unit nmol/ml. * significantly lower (p < 0.05) in comparison to control # significantly lower (p < 0.05) when compared to ADF group (2b) Protein carbonyl (PCO) content reported as nmol/mg protein. * significant decrease (p < 0.05) when compared to control, # significant decrease (p < 0.05) in comparison with ADF group. (2c) Advanced oxidation protein products (AOPP) measured as µmol/l. * significant decrease (p < 0.05) in comparison to control group. (2D) Nitric oxide (NO) level expressed as µmol/l. * significant decrease (p < 0.05) when compared to control; # significant decrease (p < 0.05) with respect to ADF group. C- control; ADF- alternate day fasting; Hes- hesperidin; ADF+Hes- alternate day fasting+ hesperidin.
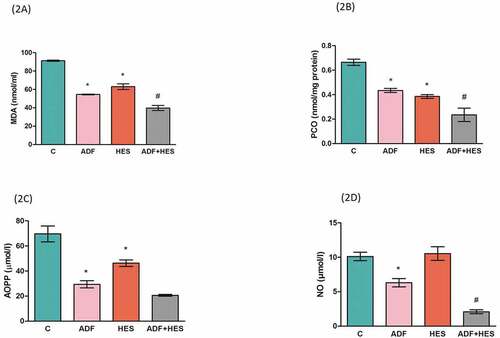
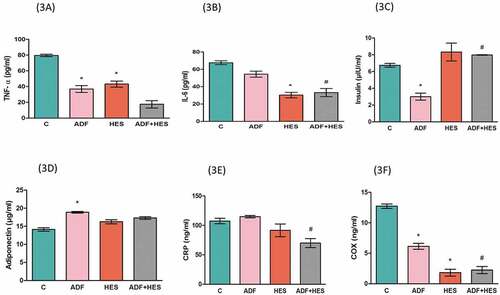
Figure 3. Figure represents the serum levels of TNF-α, IL-6, Insulin, adiponectin, CRP and COX. The values are represented as TNF-α, IL-6 in terms of pg/ml; CRP and COX as ng/ml; insulin as µIU/ml and adiponectin in µg/ml units. The significant levels are indicated as (p < 0.05) * significant change with respect to control group and # (p < 0.05) significant change in comparison with ADF group. C- control; ADF- alternate day fasting; Hes- hesperidin; ADF+Hes- alternate day fasting+ hesperidin.